present
Registe-se e receba 50 $ de desconto na sua primeira compra
Trading product for TradeLens Indicador Chart UI Tools Key Levels, image 1
TradeLens
Indicador
Versão 1.3, Sep 2026
Windows, Mac
4.5
Avaliações: 4
Trading product for TradeLens Indicador Chart UI Tools Key Levels, image 2
Trading product for TradeLens Indicador Chart UI Tools Key Levels, image 3
Trading product for TradeLens Indicador Chart UI Tools Key Levels, image 4
Trading product for TradeLens Indicador Chart UI Tools Key Levels, image 5
Trading product for TradeLens Indicador Chart UI Tools Key Levels, image 6
Trading product for TradeLens Indicador Chart UI Tools Key Levels, image 7
Trading product for TradeLens Indicador Chart UI Tools Key Levels, image 8
Trading product for TradeLens Indicador Chart UI Tools Key Levels, image 9
Trading product for TradeLens Indicador Chart UI Tools Key Levels, image 10
Trading product for TradeLens Indicador Chart UI Tools Key Levels, image 11
Desde 09/02/2026
29
Vendas
179
Instalações gratuitas

Descrição

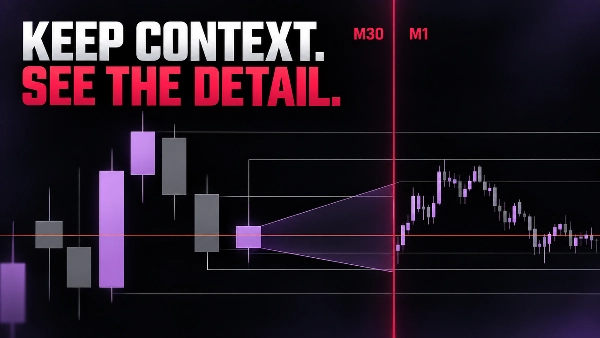
TRADELENS - MANTENHA O CONTEXTO. VEJA O DETALHE.

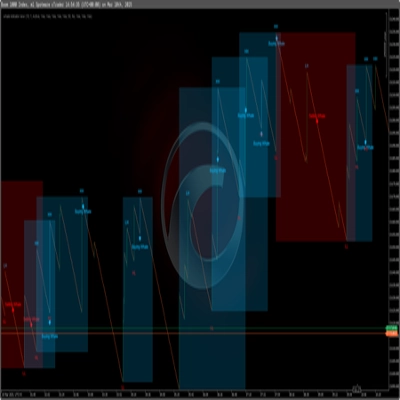
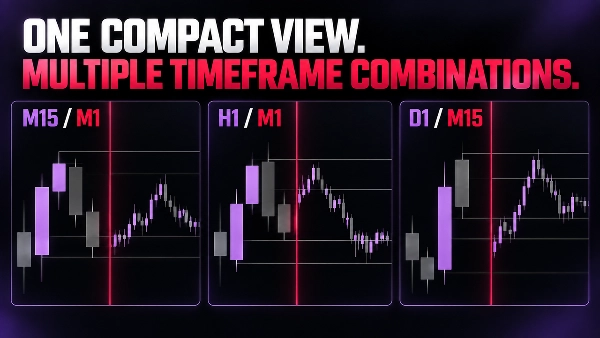
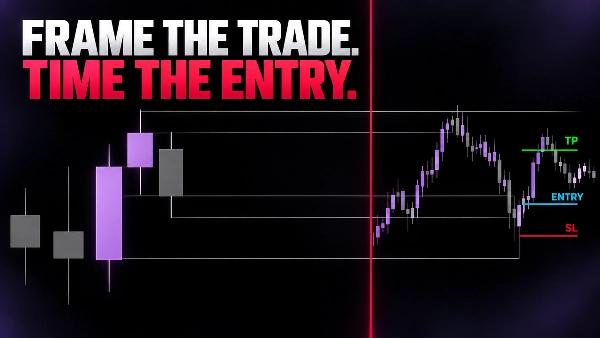
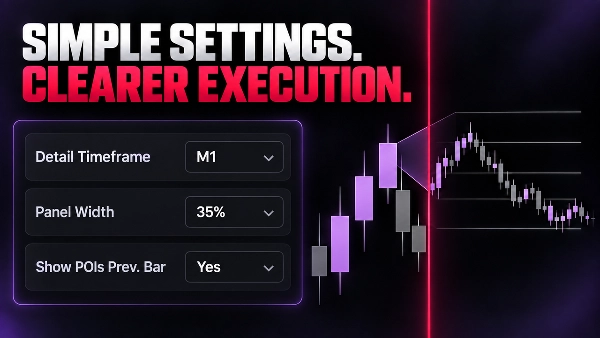
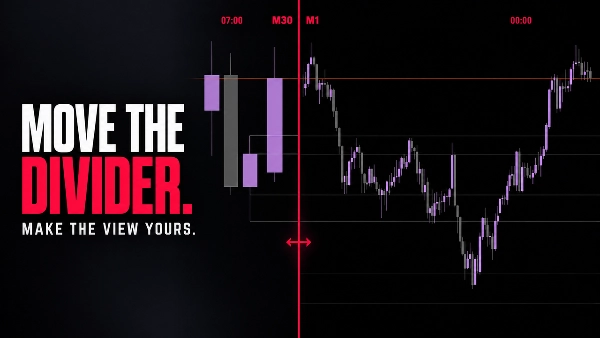
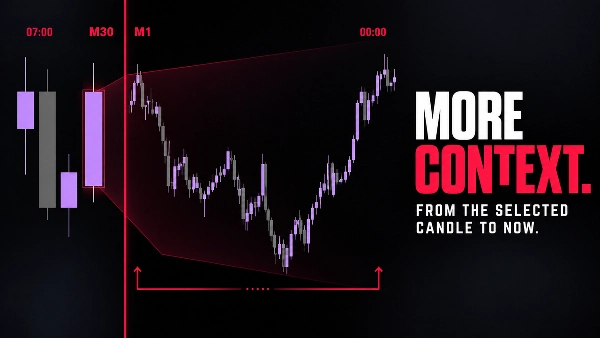
TradeLens coloca uma visualização compacta de candle de timeframe inferior diretamente dentro do seu gráfico atual. O gráfico original permanece como seu contexto de timeframe superior; o painel de detalhes mostra como o preço está se desenvolvendo dentro do candle de contexto selecionado.

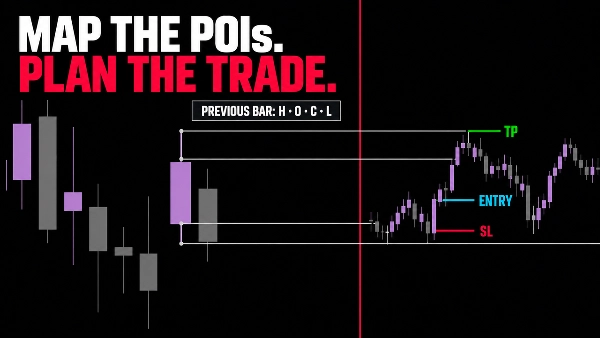
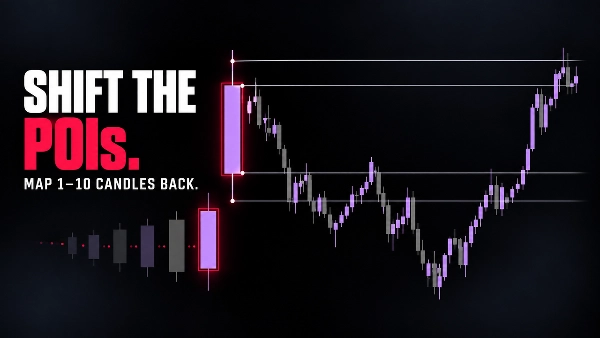
Use o candle atual em formação por padrão, ou volte para inspecionar um candle de contexto anterior. Você pode enquadrar a configuração ativa com POIs opcionais (raios) no High, Low, Open e Close da barra fechada anterior, e então estudar o movimento de timeframe inferior sem sair do gráfico.

O QUE O TRADELENS AJUDA VOCÊ A VER

  • Estrutura de timeframe superior e detalhe de timeframe inferior na mesma janela.
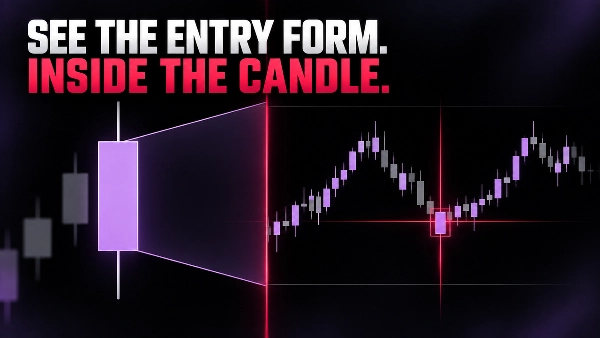
  • A progressão do candle de contexto atual em uma escala mais fina.
  • Pontos de interesse OHLC da barra anterior em todo o gráfico.
  • Combinações compactas como M15/M1, M30/M1, H1/M1, D1/M15 e D1/M30.
  • Uma forma mais limpa de refinar o timing de entrada preservando o contexto.
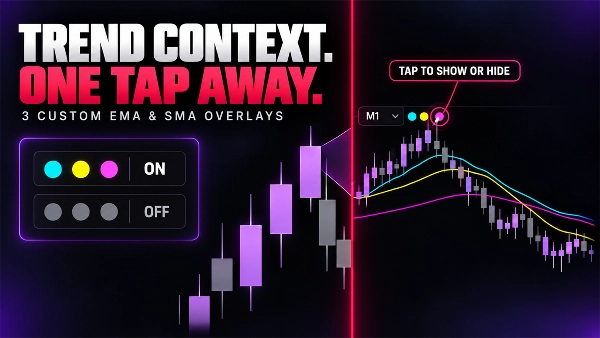
  • Adicione até três sobreposições personalizáveis de EMA ou SMA.
  • Mostre ou oculte cada média instantaneamente com controles de um toque.
  • Veja a direção da tendência diretamente dentro da visualização de timeframe inferior.

CONTROLES SIMPLES E VISUAIS

  • Timeframe de detalhe e deslocamento do candle de contexto.
  • Largura do painel de detalhes, fundo e opacidade.
  • Cores de alta, baixa, separador e rótulo.
  • POIs opcionais da barra anterior com cor e espessura configuráveis.

O timeframe de detalhe deve ser menor que o timeframe do gráfico. Se a combinação for inválida, o TradeLens oculta sua visualização e exibe um banner de configuração claro.

TradeLens é uma ferramenta de análise visual. Ela não realiza, modifica ou gerencia ordens. Exemplos mostrados na galeria ilustram um fluxo de trabalho de leitura de gráfico e não são recomendações de trade ou garantias de desempenho.


Resumo

Resumo de IA
TradeLens is a chart visualization tool designed to integrate two timeframes within a single trading chart. It embeds a compact lower-timeframe candle view inside the current higher-timeframe chart, allowing traders to observe detailed price action within the context of a broader market structure. Users can analyze the progression of the current or previous context candles at a finer scale without switching charts.

Key features include optional points of interest (POIs) marking the previous bar’s Open, High, Low, and Close levels, customizable visual settings such as detail panel size, background opacity, and color schemes for bullish, bearish, and separator elements. TradeLens supports common timeframe combinations like M15/M1, M30/M1, H1/M1, D1/M15, and D1/M30, ensuring the detail timeframe is always smaller than the context timeframe.

This tool facilitates refined entry timing by preserving higher-timeframe context while providing granular lower-timeframe insights. It is a visual analysis indicator and does not execute or manage trades. TradeLens is tagged under market structure and chart UI tools, supporting analysis related to key levels, liquidity sweeps, market structure changes, and inducements.
Perfil do indicador
Categoria do indicador
Estrutura do mercado (SMC)
Tipo de resultado
Visualização
Requisitos de dados
Apenas barras

Conversa

Avaliações de clientes

4.5
Avaliações: 4
5
50 %
4
50 %
3
0 %
2
0 %
1
0 %
Avaliações de clientes
October 24, 2026
smaller candles inside the larger one are an elegant way to retain the path within the wider move, with optional previous OHLC giving the comparison useful reference points instead of adding entry signals.
October 8, 2026
M1 candles inside an H1 candle keep the little moves and the bigger picture together. Previous OHLC can be added when needed. A handy comparison overlay, with the detail period required to stay smaller than the context period.
October 4, 2026
TradeLens displayed an embedded M1 candle view on EURUSD H1 and XAUUSD H1, M10 and Month1. Three moving averages, timeframe labels and the separator were visible. The invalid M1/M1 combination correctly triggered a clear warning. The interface works well, although low contrast and compressed detail candles can affect readability, especially on higher timeframes.
October 2, 2026
keeping M1 detail inside H1 context is a useful comparison view, with optional previous OHLC references and a clear requirement for the detail period to remain smaller than the larger candle.

Perguntas frequentes

Chart UI Tools
Key Levels
Liquidity Sweep
CHOCH
Inducement
Market Structure
Liquidity Grab
Os produtos disponíveis através da cTrader Store, incluindo bots de negociação, indicadores e plugins, são fornecidos por programadores terceiros e são disponibilizados apenas para fins informativos e de acesso técnico. A cTrader Store não é um corretor e não fornece aconselhamento em matéria de investimento, recomendações pessoais ou qualquer garantia de desempenho no futuro.

Mais deste autor

Indicador
BOS
CHOCH
+5
Spot market structure shift with ease, overlay timeframes, avoid false breakouts with open close pivots, hide chart bars
Indicador
Volume
Imbalance
+5
Spot Institutional Order Flow with Proportional Volume Bubbles & Integrated Cumulative Volume Delta (CVD) Intelligence.
Indicador
Forex
EURUSD
+5
Fimathe Indicator - Fimathe PCM - Automated Trend Channels & Levels — Ideal for live trading and backteting
Logótipo de "ZigXRay"
Bem avaliado
4.6
(5)
$29
/
$49
Indicador
CHOCH
Key Levels
+5
ZigZag Market Structure Identifier - Multi-Layer Scanner: Convergent Pivot Detection, 4-TF Overlay & Naked Chart Mode.
Plugin para desktop
Risk/Reward
Trade Journal
+5
cTrader Journal - Automatic Trade Capture. Offline Reviews. No Subscription.
Indicador
Key Levels
Break & Retest
+5
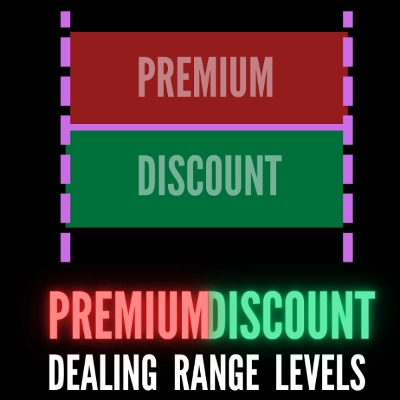
Premium Discount Levels - Professional Dealing Range Zones with Draggable Lines, Alerts, Wartermark & Backtest Mode.
cBot
Fixed Lot
TP Manager
+5
Hotkeys Trading Assistant - Professional Shortcut Assitant with Risk Manager, Hotkeys & Lot Sizing.
Indicador
Key Levels
Order Block
+5
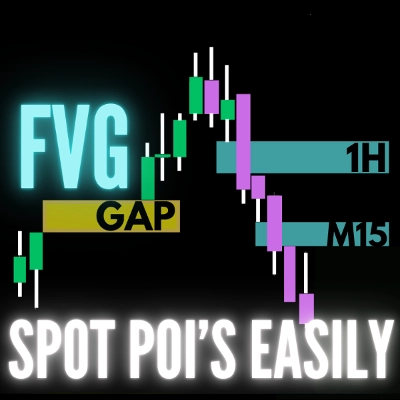
FVG Levels — Auto-Detection of Multi-Timeframe Fair Value Gaps & GAPs, Smart Filters and Liquidity Zone Monitoring

Também poderá gostar de

Indicador
Volume
Channel
+2
Identify key support and resistance levels through detailed volume distribution analysis.
Indicador
RSI
SMC
+17
RSI, MACD, Stochastic, CCI & Momentum divergence scanner with confluence scoring. Never miss a signal again!
Indicador
ATR
RSI
+4
RSI bands drawn on price, confluence-scored BUY/SELL signals, an ATR stop with three targets
Indicador
AI
Forex
+5
Whale Hunting Indicator
Indicador
ATR
Volume
+3
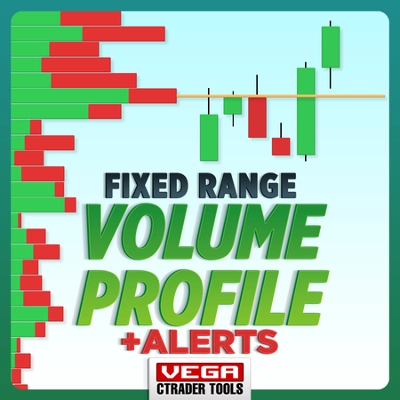
Volume profile key levels - POC, value area, volume peaks and troughs - with break, rejection and retest signals
Indicador
VWAP
Forex
+12
Unlock VWAP in cTrader! Choose anchor periods, price sources, and display deviation bands with real-time tick updates.
Indicador
Indices
Custom ADX Indicator for precise trend analysis. المؤشر المخصص ADX لتحليل الاتجاه بدقة
Indicador
Forex
BTCUSD
+10
Enhance trading with TSI! Use the True Strength Index for clear insights into market momentum and trend strength.
Indicador
Forex
BTCUSD
+10
🎯Smart Signals : Auto Buy/Sell alerts with dynamic TP/SL algorithm. 💡
Indicador
Market Sessions
Indicador
VWAP
Support & Resistance
Trading.FC$_vwap Algo shows VWAP trends, dynamic support/resistance and deviation bands to spot potential trade entries.
Indicador
ADX
ATR
+5
Configure, simulate, and analyze trading strategies with custom filters, multi-target exits, and detailed performance me
Logótipo de "AutoAVWAP"
Bem avaliado
4.5
(4)
$19
/
$25
Indicador
Prop
VWAP
+11
The best automatic anchored VWAP indicator every trader can get help from.
Indicador
Forex
Crypto
+5
The best filter for trading trend continuations on Renko charts.
Indicador
AI
Prop
+14
Professional Trading Indicator Transform Your Trading with Intelligent Signal Detection RenkoProfit
Indicador
Auto Fibonacci Retracement Indicator for cTrader
Indicador
ATR
Forex
+7
Final Moving Average is an adaptive system designed to keep traders aligned with the true direction of the market
Indicador
Volume
Key Levels
View tick activity across a selected chart range with Point of Control, Value Area High and Value Area Low.

Preço

Desde 09/02/2026
29
Vendas
179
Instalações gratuitas