
คำอธิบาย
ตัวชี้วัด Dark Cloud Cover เป็นเครื่องมือวิเคราะห์ทางเทคนิคที่ออกแบบมาเพื่อระบุรูปแบบการกลับตัวขาลงที่เป็นไปได้ในตลาด รูปแบบนี้ประกอบด้วยแท่งเทียนสองแท่งติดต่อกัน:
- แท่งเทียนขาขึ้น (สีเขียว) ที่บ่งชี้แรงซื้อที่แข็งแกร่ง
- แท่งเทียนขาลง (สีแดง) ที่เปิดเหนือราคาปิดก่อนหน้าแต่ปิดต่ำกว่ากึ่งกลางของแท่งเทียนก่อนหน้า แสดงถึงแรงกดดันจากการขาย
การก่อตัวนี้บ่งชี้ถึงการเปลี่ยนแปลงความรู้สึกของตลาดที่เป็นไปได้ ซึ่งผู้ซื้อสูญเสียการควบคุมและผู้ขายเข้ามาควบคุม
คุณสมบัติและฟังก์ชันการทำงาน:
- การตรวจจับรูปแบบ:
-
- ตัวชี้วัดจะสแกนหา Dark Cloud Cover ตามการเคลื่อนไหวราคาของแท่งเทียน
- เมื่อพบ จะเน้นรูปแบบนั้นอย่างชัดเจนเพื่อแจ้งเตือนผู้ค้า
- ตัวกรองแนวโน้ม (ไม่บังคับ):
-
- เพื่อเพิ่มความแม่นยำ ตัวชี้วัดรวมตัวกรองแนวโน้มที่เป็นทางเลือกโดยใช้ ค่าเฉลี่ยเคลื่อนที่ (MA).
- ถ้าเปิดใช้งาน รูปแบบจะถูกพิจารณาว่าถูกต้องเฉพาะเมื่อเกิดขึ้นในแนวโน้มขาขึ้น
- ตรรกะการยืนยัน:
-
- ตัวชี้วัดสามารถตรวจสอบสัญญาณขาลงโดยการตรวจสอบแท่งเทียนถัดไป
- แท่งเทียนยืนยันจะถูกระบุหากปิดต่ำกว่าจุดต่ำของ Dark Cloud Cover และมีปริมาณเทียนสูงกว่าค่าเฉลี่ยของแท่งเทียนล่าสุด
- ซึ่งช่วยให้มั่นใจในความน่าเชื่อถือของสัญญาณที่แข็งแกร่งขึ้น
- เครื่องหมายแสดงผล:
-
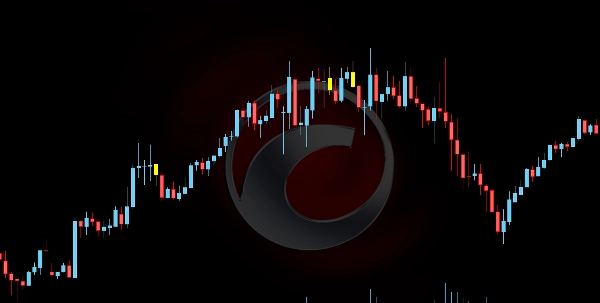
- แท่งเทียนสีเหลือง: แสดงรูปแบบ Dark Cloud Cover ที่ตรวจพบ
- แท่งเทียนสีส้ม: เน้นแท่งเทียนยืนยันหากเงื่อนไขปริมาณเป็นไปตามที่กำหนด
ตัวชี้วัดนี้ช่วยให้ผู้ค้าสามารถมองเห็นการตั้งค่าการกลับตัวที่มีความน่าจะเป็นสูง ช่วยปรับปรุงการตัดสินใจสำหรับการเข้าทำรายการสั้นหรือกลยุทธ์การจัดการความเสี่ยง
สรุป
สรุปโดย AI
The Dark Cloud Cover indicator is a technical analysis tool that identifies a specific bearish reversal candlestick pattern. This pattern consists of two candles: a bullish (green) candle indicating strong buying momentum, followed by a bearish (red) candle that opens above the previous close but closes below the midpoint of the prior candle, signaling selling pressure and a potential shift from buyers to sellers.
Key features include:
- **Pattern Detection:** Automatically scans for the Dark Cloud Cover pattern based on candlestick price action and visually highlights detected patterns for trader awareness.
- **Optional Trend Filter:** Incorporates a Moving Average (MA) filter to validate patterns only during uptrends, enhancing signal accuracy.
- **Confirmation Logic:** Validates bearish signals by analyzing the subsequent candle, which must close below the pattern’s low with higher-than-average tick volume to confirm the reversal.
- **Visual Markers:** Uses yellow candles to mark detected patterns and orange candles to highlight confirmation candles meeting volume criteria.
This indicator assists traders in recognizing high-probability bearish reversal setups, supporting decision-making for short entries and risk management strategies.
โปรไฟล์อินดิเคเตอร์
รีวิวจากลูกค้า
0.0
รีวิว: 0
รีวิวจากลูกค้า
ยังไม่มีรีวิวสำหรับผลิตภัณฑ์นี้ หากเคยลองแล้ว ขอเชิญมาเป็นคนแรกที่บอกคนอื่น!
การสนทนา
คำถามที่พบบ่อย
Signal
ผลิตภัณฑ์ที่มีให้บริการผ่าน cTrader Store รวมถึงบอทการเทรด อินดิเคเตอร์ และปลั๊กอิน มีให้บริการโดยนักพัฒนาบุคคลที่สามและมีไว้เพื่อวัตถุประสงค์ในการเข้าถึงข้อมูลและทางเทคนิคเท่านั้น cTrader Store ไม่ใช่โบรกเกอร์และไม่ได้ให้คำแนะนำการลงทุน คำแนะนำส่วนบุคคล หรือการรับประกันผลการดำเนินงานในอนาคต
เพิ่มเติมจากผู้เขียนคนนี้


ราคา
5
การขาย
435
ติดตั้งฟรี