RT Bollinger Bands Cloud
Indicateur
Version 1.0, Sep 2024
Windows, Mac
Description
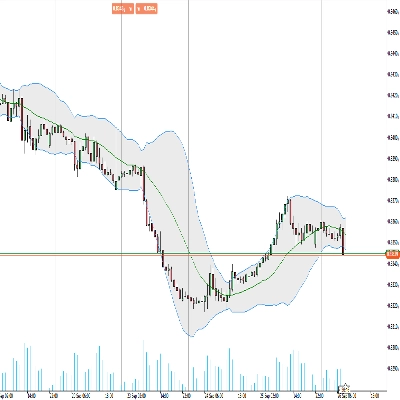
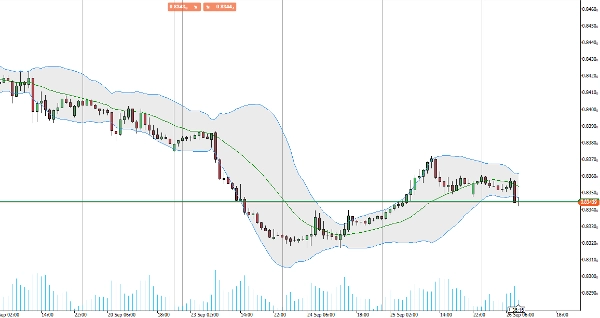
Présentation de notre indicateur Bollinger Bands amélioré, conçu pour améliorer votre expérience de trading avec une visualisation plus claire.
Cette amélioration visuelle facilite l'interprétation de la volatilité du marché et l'identification des points potentiels de rupture et de retournement. Idéal pour les traders recherchant des informations plus claires et une meilleure prise de décision.
Améliorez votre boîte à outils de trading dès aujourd'hui pour une analyse plus précise et de meilleurs résultats.
Résumé
Profil de l'indicateur
Avis clients
0.0
Avis : 0
Avis clients
Il n'y a pas encore d'avis sur ce produit. Vous l'avez déjà essayé ? Soyez le premier à en parler aux autres !
Discussion
Questions fréquentes
BTCUSD
Forex
Breakout
Indices
EURUSD
Commodities
GBPUSD
NZDUSD
Bollinger
Scalping
Crypto
Stocks
XAUUSD
NAS100
USDJPY
Les produits disponibles sur cTrader Store, notamment les bots de trading, les indicateurs et les plug-ins, sont fournis par des développeurs tiers et mis à disposition à titre informatif et à des fins d'accès technique uniquement. cTrader Store n'est pas un courtier et ne fournit aucun conseil en investissement, aucune recommandation personnelle ni aucune garantie quant aux performances futures.


![Logo de "[Stellar Strategies] Market Session Ultimate"](https://cdn.ctrader.com/image/webp/61ffd537-0125-4246-9e72-42eca1791d64_28232)


Prix
Depuis le 25/09/2024
20
Ventes