
Deskripsi
Indikator Waktu Untuk Break Even v2
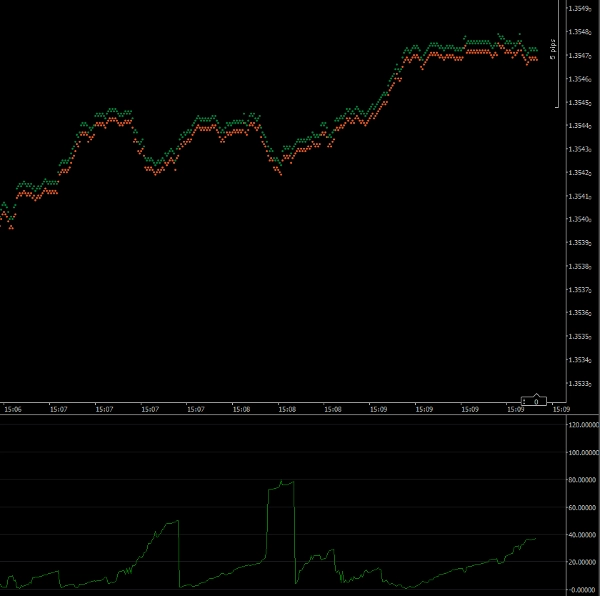
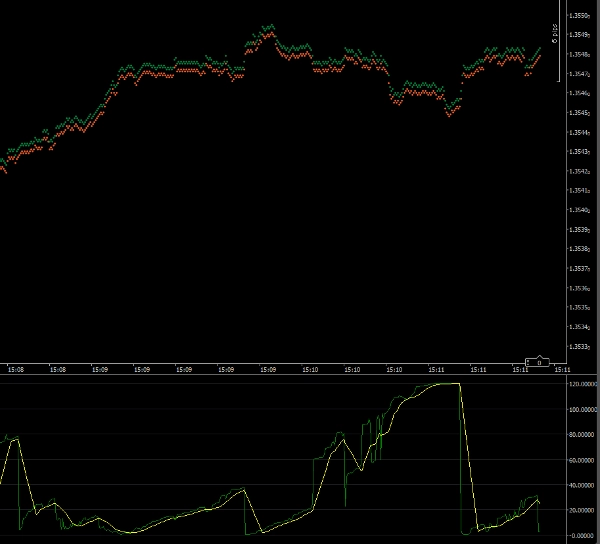
Indikator ini akan membantu Anda menentukan waktu masuk perdagangan ke pasar. Grafik menunjukkan perkiraan jumlah detik agar perdagangan Anda mencapai break even. Jika pasar bergerak cepat dan sesuai arah Anda, maka indikator akan memberikan angka kecil. Jika pasar bergerak berlawanan dengan Anda atau lambat, angkanya akan lebih besar.
Indikator menghitung jumlah pip yang diperlukan perdagangan Anda untuk mencapai break even. Kemudian membandingkannya dengan kecepatan saat ini di mana harga bergerak.
Catatan: Indikator ini harus dijalankan pada Time Frame 1 Tick.
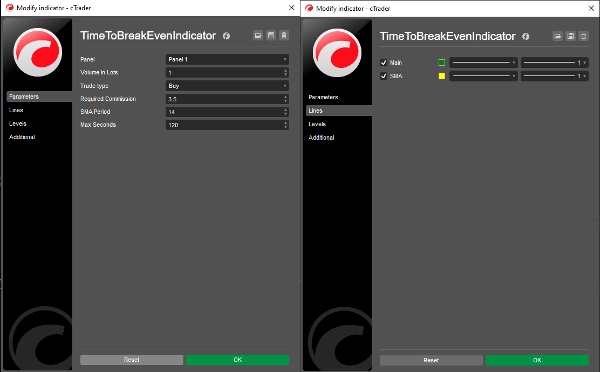
Parameter
Volume dalam Lot: Volume perdagangan yang Anda usulkan
Jenis Perdagangan: Apakah perdagangan Anda untuk beli atau jual
Komisi yang Diperlukan: Komisi yang akan dikenakan pada perdagangan Anda (Anda dapat memperoleh ini dari jendela Quick Trade)
Periode SMA: Periode plot Simple Moving Average (default = 14)
Detik Maksimum: Jumlah maksimum detik yang akan dicatat (lihat di bawah)
Garis
Utama: Garis plot indikator (default = hijau)
SMA: Garis plot Simple Moving Average (default = kuning)
Detik Maksimum
Mengizinkan indikator menampilkan nilai yang sangat besar berarti skala indikator akan mencegah Anda melihat detail ketika waktu untuk break even kecil. Mengatur parameter ini memungkinkan Anda menetapkan skala maksimum indikator. Secara default diatur ke 120 (2 menit). Jadi setiap output 2 menit atau lebih akan diplot sebagai 120 detik.
Dr Andy Larkin
Hak Cipta 2025, Semua Hak Dilindungi
26 Mei 2025
Legal
Hasil dari indikator ini harus diperiksa keakuratannya sebelum digunakan dalam perdagangan langsung.
Tidak ada jaminan yang diberikan atau tersirat untuk hasil dari indikator ini.
Tidak ada tanggung jawab yang diterima atas kerugian yang timbul sebagai akibat penggunaan indikator ini.
Ringkasan
Ulasan pelanggan
5 | 50 % | |
4 | 50 % | |
3 | 0 % | |
2 | 0 % | |
1 | 0 % |


