
50 percent
Индикатор
Версия 1.0, Aug 2025
Windows, Mac
5.0
Отзывы: 2

Описание
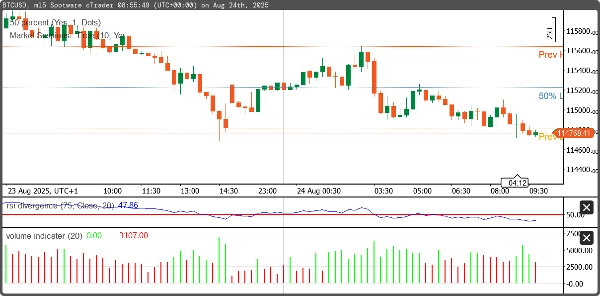
Этот cBot автоматически определяет максимумы и минимумы предыдущей сессии и вычисляет среднюю точку между ними. Он предназначен для помощи трейдерам, выявляя ключевые зоны поддержки/сопротивления и уровни рыночного равновесия, которые часто используются для стратегий разворота или прорыва.
- Определяет максимум и минимум предыдущего дня (или сессии).
- Вычисляет среднюю точку между максимумом и минимумом.
- Отображает уровни максимума, минимума и средней точки на графике.
Сводка
Профиль индикатора
Отзывы покупателей
5.0
Отзывы: 2
5 | 100 % | |
4 | 0 % | |
3 | 0 % | |
2 | 0 % | |
1 | 0 % |
Отзывы покупателей
August 29, 2025
The screen feels less crowded, but the final call still needs say no.
August 20, 2025
Обсуждение
Частые вопросы
Продукты, доступные в cTrader Store, включая торговых ботов, индикаторы и плагины, предоставляются сторонними разработчиками и доступны исключительно в информационных и технических целях. cTrader Store не является брокером и не предоставляет инвестиционные консультации, персональные рекомендации или какие-либо гарантии будущей доходности.
Больше от этого автора


Цена
С 14/05/2025
10.1M
Торгуемый объем
81.44K
Выигранные пипы
205
Бесплатные установки