Описание
BullBear Dynamics — индикатор тренда и импульса для cTrader
BullBear Dynamics — это надежный индикатор с учетом волатильности для платформы cTrader, созданный, чтобы помочь трейдерам обнаруживать и интерпретировать баланс между бычьим и медвежьим импульсом на рынке. Он сочетает скользящие средние, нормализацию ATR и динамические пороги, чтобы предоставить точный, визуально интуитивный инструмент для оценки тренда.
Методология и внутренняя логика
Индикатор вычисляет две экспоненциальные скользящие средние (EMA): краткосрочную EMA и долгосрочную EMA.
Затем он берет разницу между этими EMA и делит её на средний истинный диапазон (ATR). Эта нормализация помогает корректировать сигналы импульса в зависимости от текущей волатильности рынка.
Сигнальная линия — EMA, применённая к нормализованным значениям — фильтрует шум и сглаживает незначительные колебания.
Чтобы различать слабые и сильные движения, инструмент вычисляет скользящее стандартное отклонение (StdDev) за окно обзора и умножает его на коэффициент для определения верхних и нижних порогов.
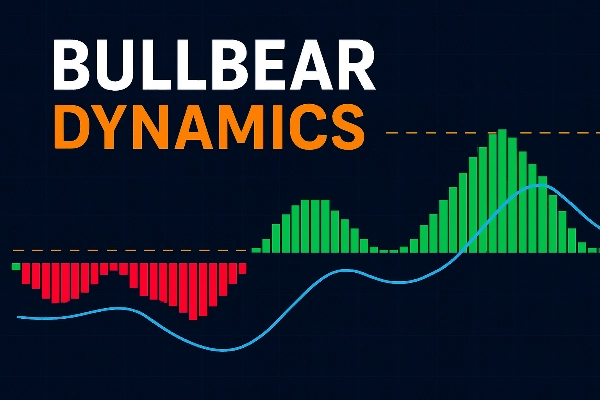
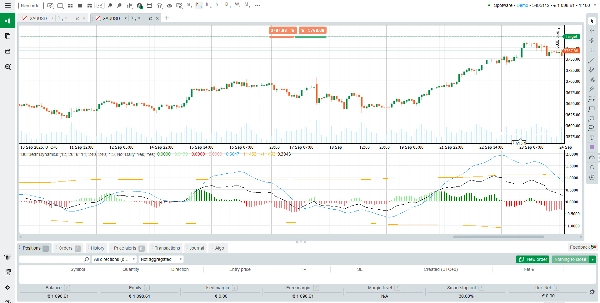
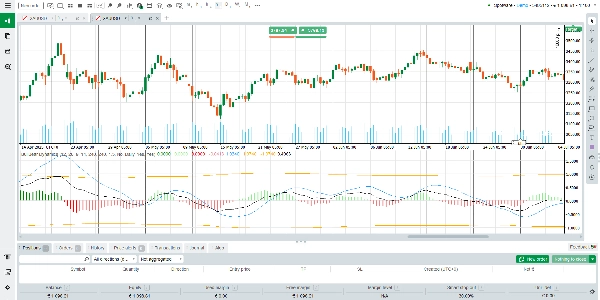
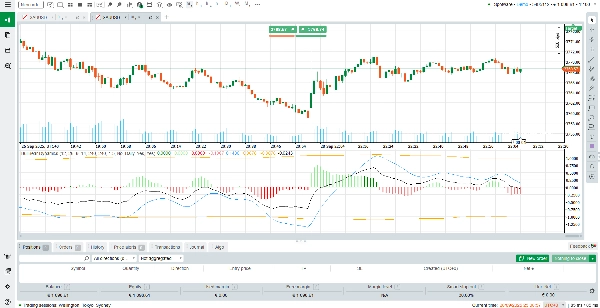
Итоговый результат визуализируется в виде гистограммы (с несколькими цветовыми состояниями) плюс сигнальная линия и границы порогов.
Как читать и интерпретировать результат
Столбцы гистограммы (зеленые / красные):
• Зеленый цвет указывает на бычий импульс; красный — на медвежий импульс.
• Яркий или насыщенный цвет означает, что гистограмма превышает порог — что подразумевает сильное движение.
• Более слабый цвет означает, что гистограмма остается внутри пороговых границ — что подразумевает слабый импульс или шум.
Сигнальная линия:
• Служит опорной базовой линией.
• Когда гистограмма пересекает сигнальную линию сверху вниз, это сигнализирует о возможном усилении бычьего импульса.
• Когда пересекает снизу вверх — сигнализирует о возможном усилении медвежьего импульса.
Пороговые линии (верхняя и нижняя):
• Эти пунктирные линии определяют зоны значимости.
• Столбец гистограммы, пересекающий порог, обозначает сильное движение с высокой степенью уверенности.
• Столбцы, остающиеся внутри порогов, указывают на диапазон или неопределенность — сигналы менее надежны.
Сценарии и интерпретации:
Бычий импульс — зеленые столбцы выше сигнальной линии, желательно также пересекающие верхний порог.
Медвежий импульс — красные столбцы ниже сигнальной линии, желательно также пересекающие нижний порог.
Нейтральный / боковой тренд — столбцы колеблются внутри порогов, цвета могут чередоваться, амплитуда небольшая.
Смена импульса или разворот — гистограмма пересекает сигнальную линию, сопровождаясь изменением цвета; если также пробивает порог, сигнал более надежен.
Рекомендации по использованию и лучшие практики
Используйте BullBear Dynamics в сочетании с другими инструментами (фильтры тренда, уровни поддержки/сопротивления, анализ паттернов) для подтверждения.
Будьте осторожны при интерпретации сигналов в периоды низкой волатильности, когда столбцы гистограммы остаются внутри порогов.
Отдавайте приоритет сигналам, когда гистограмма пересекает сигнальную линию и пробивает пороги.
Подтверждайте направление на старших таймфреймах перед тем, как действовать по сигналам с младших таймфреймов.
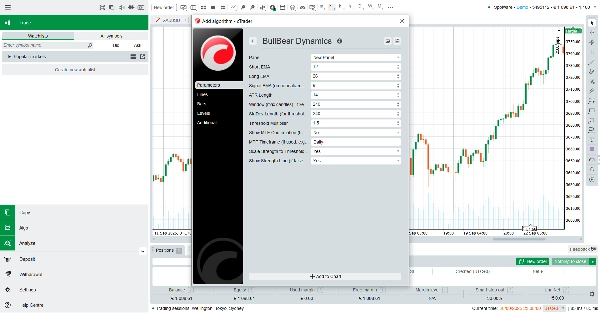
Настраивайте параметры (длины EMA, множитель порога, окно StdDev) по мере необходимости для разных рынков (Forex, индексы, сырьевые товары, криптовалюты).
Ключевые особенности и преимущества
Адаптивная нормализация по волатильности — импульс масштабируется с помощью ATR, что делает сигналы более надежными в различных рыночных условиях.
Динамические пороги — построены на основе скользящего стандартного отклонения, они адаптируются к текущим рыночным условиям, помогая снизить количество ложных пробоев.
Четкая многоцветная гистограмма — визуальное различие между сильным и слабым импульсом, а также между бычьим и медвежьим движением.
Широкая совместимость — работает со всеми инструментами и таймфреймами, поддерживаемыми cTrader.
Бесплатное использование — доступен без оплаты; идеально подходит для трейдеров, желающих получить расширенные возможности индикатора без подписки.
Сводка
The output is displayed as a multi-color histogram with green bars indicating bullish momentum and red bars indicating bearish momentum. The intensity of the colors reflects the strength of the momentum relative to dynamically calculated upper and lower thresholds. The signal line serves as a baseline to identify potential momentum shifts when the histogram crosses it. Threshold lines mark zones of significant momentum moves, with bars crossing these lines signaling stronger trends.
BullBear Dynamics supports all instruments and timeframes available on cTrader, including Forex, commodities, indices, and cryptocurrencies. It is recommended to use this indicator alongside other analysis tools for confirmation and to adjust its parameters to fit different market conditions and trading styles such as scalping.
Отзывы покупателей
5 | 100 % | |
4 | 0 % | |
3 | 0 % | |
2 | 0 % | |
1 | 0 % |