Описание
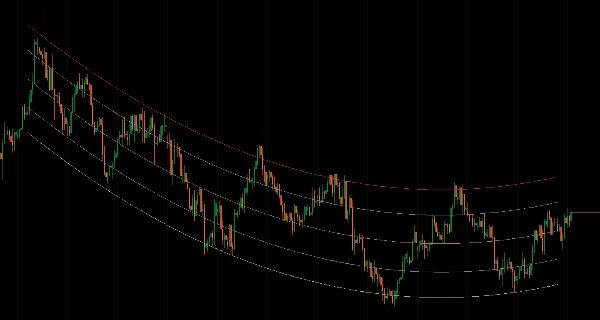
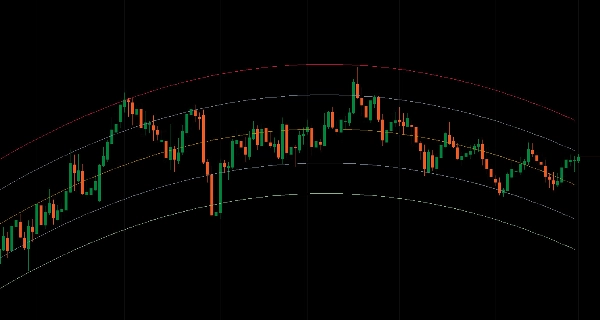
Статистические регрессионные каналы с уровнями Фибоначчи для различных типов расчетов, таймфреймов и диапазонов дат.
Подгоняет линии регрессии по ценовым данным с использованием восьми методов (линейный, логарифмический, экспоненциальный, взвешенный, полиномиальный, скользящий, экспоненциальный скользящий, LOWESS) с полосами стандартного отклонения для анализа возврата к среднему.
Девять уровней канала Фибоначчи (от 0% до 100%), мульти-таймфреймовый анализ по 16 периодам с интерполированной отрисовкой, три режима расчета (на основе периода, диапазона дат, MTF), управление степенью полинома (1-5) для криволинейных трендовых структур, множитель стандартного отклонения для регулировки ширины канала, разбор дат и времени с учетом часового пояса для анализа событий, проекция трендовой линии до бесконечности и оптимизированное LRU-кэширование обеспечивают комплексный статистический регрессионный анализ для трейдеров, ориентированных на зоны возврата к среднему и криволинейные ценовые структуры в различных рыночных условиях.
ОСОБЕННОСТИ
8 типов расчетов регрессии
- Линейный: классическая линейная регрессия наименьших квадратов
- Логарифмический: регрессия на основе натурального логарифма для экспоненциальных движений цены
- Экспоненциальный: подгонка экспоненциальной кривой для ускоряющихся трендов
- Взвешенный: линейная регрессия с большим весом для последних баров
- Полиномиальный: криволинейные подгонки (степень 1-5) для нелинейных трендов
- Скользящий: регрессия на основе скользящего среднего
- Экспоненциальный скользящий: регрессия на основе EMA для сглаживания тренда
- LOWESS: локально взвешенная регрессия для адаптивного сглаживания
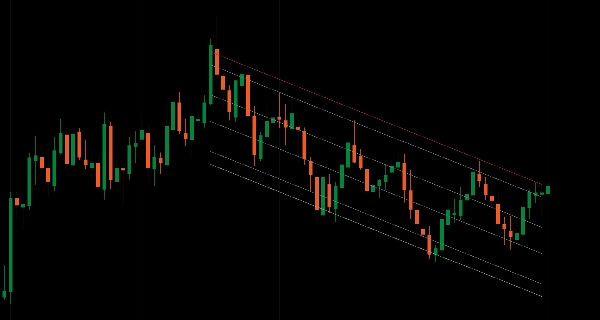
9 уровней канала Фибоначчи
- Полный диапазон канала: 100% (верхний), 88.6%, 76.4%, 61.8%, 50% (средняя линия), 38.2%, 23.6%, 11.4%, 0% (нижний)
- Зоны возврата к среднему внутри полос регрессии
- Точные опорные/сопротивляющиеся точки
- Независимое управление цветом/стилем/толщиной для каждого уровня
Мульти-таймфреймовый анализ
- Расчет регрессии на более высоком таймфрейме, отображение на текущем графике
- Доступно 16 таймфреймов (от m1 до месячного)
- Интерполированные значения канала для плавной отрисовки по барам графика
- Структура более высокого таймфрейма без переключения графиков
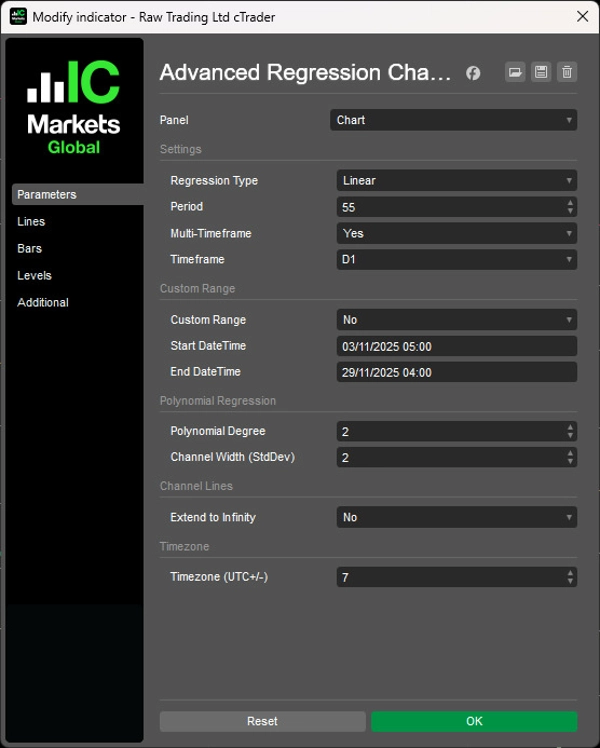
3 режима расчета
- На основе периода: скользящее окно из N баров (по умолчанию)
- Диапазон дат: пользовательские начальная/конечная дата и время для конкретных событий или фаз с учетом часового пояса (UTC+/- смещение)
Опции отображения канала
- Стандартный вывод: отображение всех 9 уровней в виде линий индикатора
- Продление до бесконечности: отрисовка в виде трендовых линий, проецируемых вперед бесконечно
- Автоматическое обновление при изменении цветов/стилей
- Чистая отрисовка — без остаточных значений за пределами окна расчета
Режим диапазона дат
- Определение точных начальных/конечных дат (формат dd/MM/yyyy HH:mm)
- Анализ конкретных рыночных событий, фаз или структур
- Независимо от параметра периода
- Преобразование часового пояса из локального времени пользователя в серверное время
Динамический расчет
- Обновления в реальном времени по мере формирования новых баров
- Оптимизированное LRU-кэширование с отслеживанием измененных диапазонов
- Адаптивный размер кэша в зависимости от таймфрейма
- Бинарный поиск для быстрого поиска по диапазону дат
Управление шириной канала
- Множитель стандартного отклонения (по умолчанию 2.0)
- Шире полосы для расширения волатильности
- Уже полосы для рынков с ограниченным диапазоном
- Последовательно для всех типов регрессии
Полиномиальная регрессия
- Управление степенью: 1-5 (больше = больше кривизны)
- Улавливает нелинейные тренды
- Полезна для параболических или криволинейных ценовых структур
- Переходит к линейной при степени = 1
Чистое визуальное управление
- Расчет только по завершенным барам — не по формирующимся
- Правильное усечение мульти-таймфреймов — линии заканчиваются на последнем завершенном баре HTF
- Экстраполяция на основе наклона для последовательной направленной проекции
- Чистые выходные серии с описательными названиями уровней
__________________________________________________________________________________________
БОЛЬШЕ БЕСПЛАТНЫХ ИНДИКАТОРОВ
Изучите широкий спектр инструментов рыночного анализа — от структуры и объема до регрессии, волатильности и пользовательских таймфреймов.
Исходный код доступен в репозитории на GitHub repository.
Все бесплатно для использования. Но если хотите поддержать кофе, можете отправить поддержку здесь.
Поддержка/Сопротивление
Объем
- Volume Activity Profiler
- Volume Efficiency Analyzer
- Volume Profile Analytics
- Volume Profile - Updated
- Volume Spread Analysis
- VWAP (Volume Weighted Average Price)
Скользящие средние
- SSL Channel
- Anchored Moving Average
- Deviation-Scaled Moving Average
- Gann High Low Activator
- Instantaneous Trendline
- Kaufman Adaptive MA with Trend Vision
- Moving Average Channel
- Moving Averages Suite
- Trend Channel Moving Average
Утилиты/Пользовательские
На основе регрессии
Волатильность
Осцилляторы
__________________________________________________________________________________________
ОТКАЗ ОТ ОТВЕТСТВЕННОСТИ
Торговля связана с риском. Этот индикатор предназначен только для технического анализа — всегда применяйте надлежащее управление рисками и торгуйте ответственно.
ОБРАТНАЯ СВЯЗЬ И УЛУЧШЕНИЯ
Если у вас есть предложения, запросы функций или идеи для улучшения, пожалуйста, оставьте комментарий во вкладке Обсуждение. Ваш отзыв помогает улучшить индикатор для всех.
Сводка
It offers multi-timeframe analysis across 16 periods (from 1 minute to monthly), enabling regression calculations on higher timeframes displayed on the current chart with smooth interpolated rendering. Users can select among three calculation modes: Period-Based (rolling window), Date Range (custom start/end with timezone-aware parsing), and Multi-Timeframe. Channel width is adjustable via a standard deviation multiplier to reflect market volatility.
The indicator features real-time dynamic updates, optimized caching for performance, and extend-to-infinity trendline projections for forward-looking analysis. Visual output is clean, with slope-based extrapolation and no calculations on forming bars. This tool is designed for traders analyzing mean reversion and complex price structures across various market conditions.