Descripción
El indicador TECHNICAL ANALYSIS es una solución avanzada de análisis técnico desarrollada para la plataforma cAlgo, que integra múltiples indicadores técnicos enfocados en identificar tendencias robustas, el impulso del mercado y la confirmación de volumen. Combina el ADX (Índice Direccional Promedio) con análisis de pendiente, filtrado de volumen y análisis técnico multindicador en tiempo real, ofreciendo a los traders una visión completa y confiable para la toma de decisiones.
🔍 Estrategia Principal
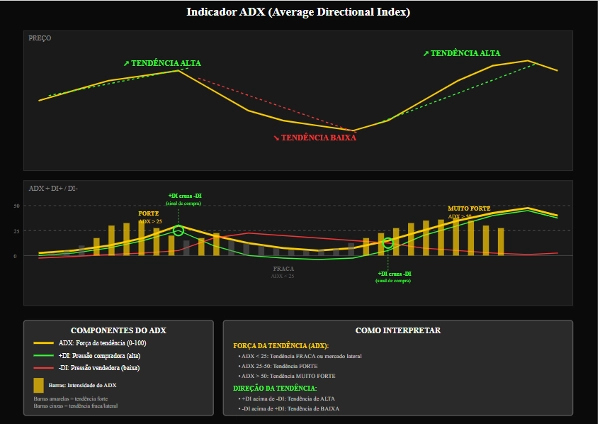
1. Base: ADX + DI (Sistema de Movimiento Direccional)
El núcleo del indicador es el ADX (Índice Direccional Promedio), que mide la fuerza de la tendencia.
Los componentes +DI (Indicador Direccional Positivo) y -DI (Indicador Direccional Negativo) identifican la dirección de la tendencia:
+DI > -DI → Tendencia alcista
-DI > +DI → Tendencia bajista
2. Análisis Dinámico del Impulso con Pendiente
La pendiente del ADX, +DI y -DI se calcula usando regresión lineal.
Esto permite identificar si la tendencia está:
Ganando fuerza (pendiente positiva)
Perdiendo fuerza (pendiente negativa)
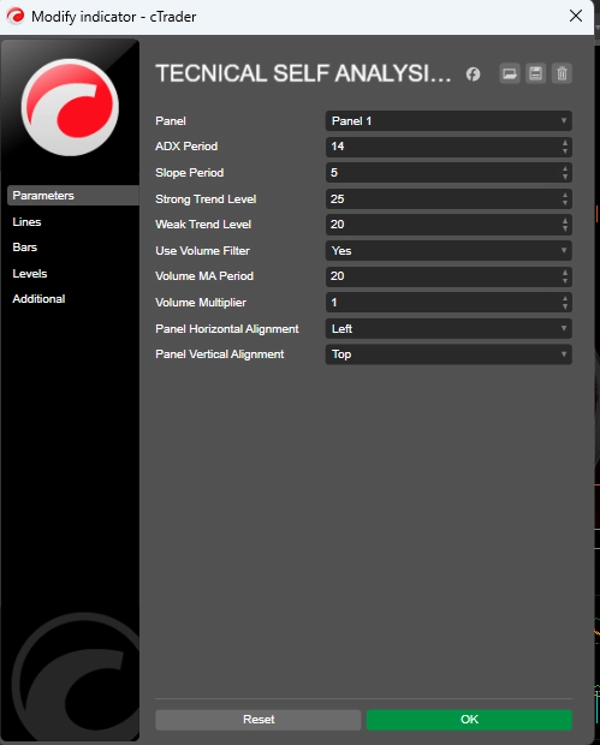
3. Niveles de Referencia
Nivel de Tendencia Fuerte: Nivel por encima del cual la tendencia se considera fuerte (por defecto: 25)
Nivel de Tendencia Débil: Nivel mínimo para considerar una tendencia válida (por defecto: 20)
Las tendencias por debajo del nivel débil se tratan como laterales o sin una dirección clara.
📈 Generación de Señales
Condiciones de Compra
✅ +DI cruza por encima de -DI
✅ ADX por encima del nivel de tendencia débil (Nivel de Tendencia Débil)
✅ Pendientes positivas de ADX y +DI
✅ Confirmación de volumen (opcional)
Condiciones de Venta
✅ -DI cruza por encima de +DI
✅ ADX por encima del nivel de tendencia débil (Nivel de Tendencia Débil)
✅ Pendientes positivas de ADX y -DI
✅ Confirmación de volumen (opcional)
Señales Fuertes: Cuando el ADX está por encima del Nivel de Tendencia Fuerte y las pendientes son significativamente positivas, el indicador genera señales reforzadas, evitando entradas consecutivas repetidas. 📊 Filtro de Volumen (Opcional)
El indicador puede requerir confirmación de volumen antes de generar señales.
El volumen actual debe ser mayor o igual al promedio móvil del volumen × multiplicador.
Esto ayuda a filtrar falsas rupturas y señales en mercados ilíquidos.
🧠 Análisis Técnico Avanzado (Panel Interactivo)
TECHNICAL ANALYSIS incluye dos paneles interactivos en el gráfico:
1. INFO DE TENDENCIA
Tipo de Tendencia: Alcista / Bajista / Lateral
Fuerza de la Tendencia: Fuerte / Débil
Impulso: Fortaleciendo / Debilitando / Estable
Valores actuales de ADX, +DI, -DI y Pendiente
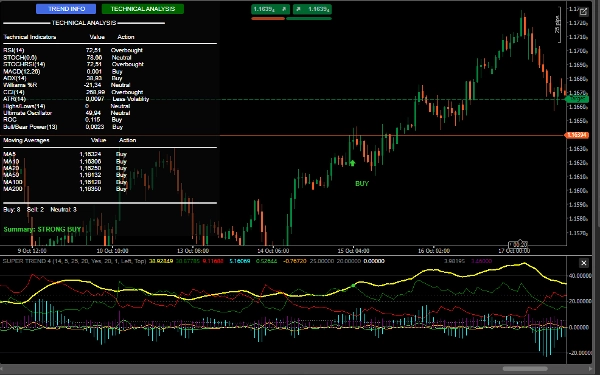
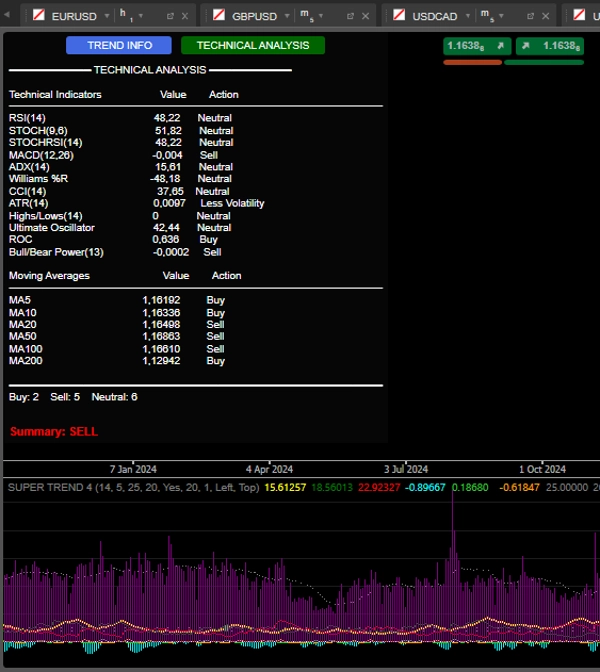
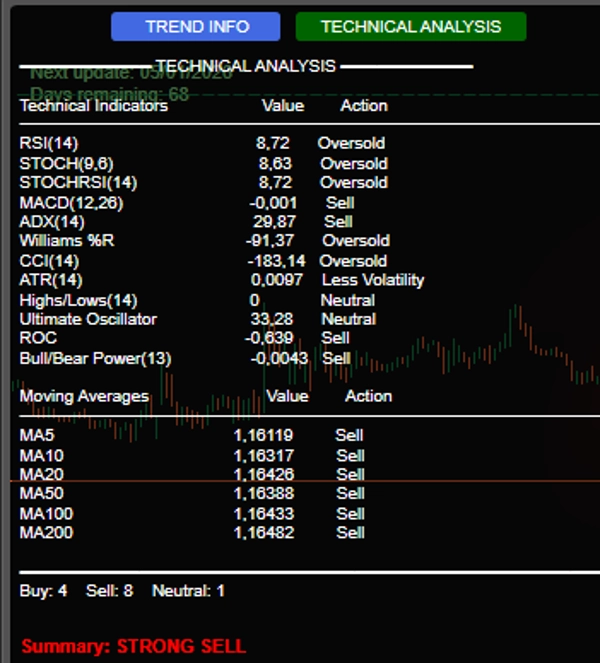
2. ANÁLISIS TÉCNICO
Realiza un análisis multindicador en tiempo real, incluyendo:
RSI(14) – Sobrecompra/Sobreventa
Estocástico(14) – Impulso
MACD(12,26) – Cruces y divergencias
Williams %R – Extremos del mercado
CCI(14) – Desviaciones del precio típico
ROC(12) – Tasa de cambio
Oscilador Ultimate – Confirmación de fuerza
Bull/Bear Power – Presión de compra/venta
Medias Móviles (5,10,20,50,100,200) – Tendencia a largo plazo
Resumen Final: El sistema cuenta las señales de compra/venta/neutral y emite una recomendación clara:
COMPRA FUERTE (≥7 señales de compra)
COMPRA
VENTA
VENTA FUERTE (≥7 señales de venta)
NEUTRAL
🔔 Alertas y Visualización
Señales visuales en el gráfico:
Flechas verdes/rojas con etiquetas "BUY"/"SELL"
Notificaciones sonoras (Windows)
Registros detallados en la consola con:
Hora de la señal
Valores de ADX, DI y volumen (si está habilitado)
🛡️ Ventajas Competitivas
✅ Integración de múltiples indicadores en un solo panel
✅ Enfoque en la fuerza y dirección de la tendencia (no solo precio)
✅ Filtro de volumen para mayor confiabilidad
✅ Interfaz interactiva e informativa
✅ Señales claras con alertas visuales y sonoras
Esta es una versión de prueba.