
الوصف
🌟 **ما هو مقياس Z-Score؟** 🌟
• **مقياس Z-Score في التداول**: هو طريقة لقياس مدى بعد السعر الحالي عن متوسطه الأخير، معبرًا عنه بوحدات الانحراف المعياري. 😊 قيمة قريبة من 0 تشير إلى أن السعر قريب من المتوسط، بينما القيم العالية (إيجابية أو سلبية) 😮 تشير إلى أنه انحرف بشكل كبير.
• **الفائدة الإحصائية**: تتيح لك هذه القيم التعرف على الحالات التي يكون فيها السعر "مفرط الشراء" 📈 أو "مفرط البيع" 📉، وهو ما يمكن أن يكون مفيدًا لاستراتيجيات العودة إلى المتوسط أو لاكتشاف لحظات التقلب العالي 💥.
🌟 **كيف يعمل المؤشر** 🌟
1. **حساب المتوسط والانحراف**:
- يتم تحليل عدد محدد من الأعمدة السابقة (أو الفترات) لحساب متوسط سعر الإغلاق وانحرافه المعياري. 🧮
- باستخدام هذه القيم، يتم تحديد مدى انحراف السعر الحالي عن المتوسط. هذا الفرق يُعبر عنه كمقياس Z-Score.
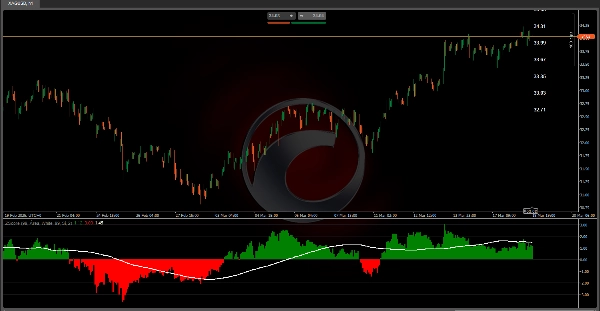
2. **تصوير مقياس Z-Score**:
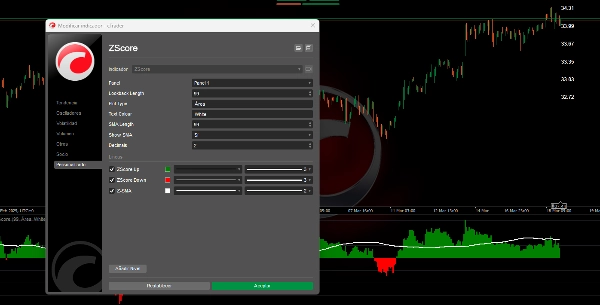
- **وضع المنطقة**: يتم عرض رسمين بيانيين عموديين: واحد باللون الأخضر 🟩 للقيم الإيجابية (عندما يكون السعر فوق المتوسط) وآخر باللون الأحمر 🔴 للقيم السلبية (عندما يكون أدناه). هذا يسمح لك بالتعرف بصريًا على حجم واتجاه الانحراف.
3. **المتوسط المتحرك لمقياس Z-Score**:
- يتم حساب متوسط متحرك على قيم مقياس Z-Score. هذا يساعد على تنعيم التقلبات وتحديد الاتجاهات في كيفية تصرف انحراف السعر مع مرور الوقت. 📊
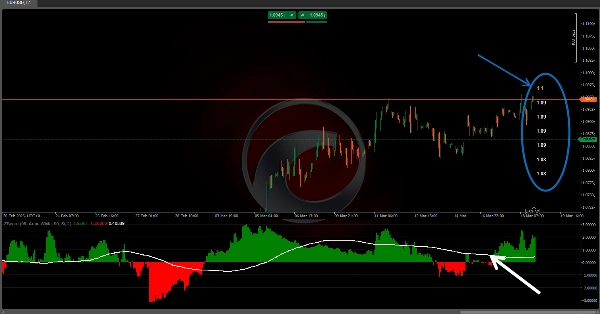
4. **مناطق الاحتمالية والتسميات المرجعية**:
- بالإضافة إلى ذلك، توضع تسميات على الرسم البياني تُظهر الأسعار المقابلة للمتوسط ولكل مستوى من مستويات الانحراف. هذا مفيد لفهم، من حيث السعر، مدى "شذوذ" سلوك السوق. ⚠️
---
🌟 **التفسير والتطبيق للمتداولين** 🌟
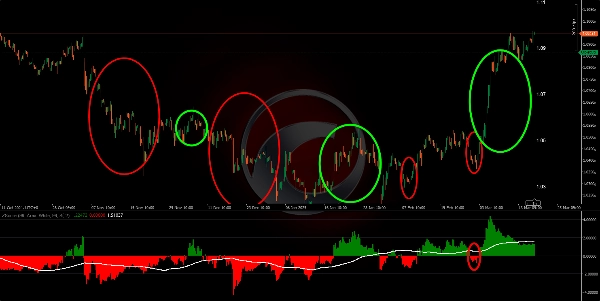
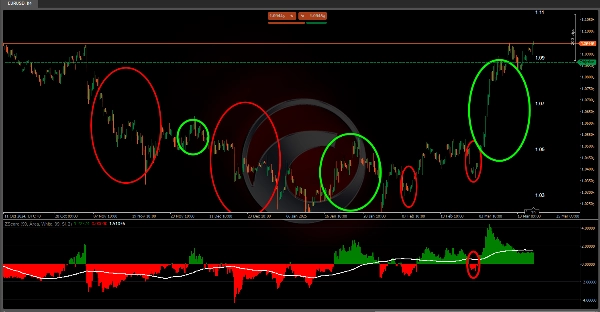
• **كشف القمم والقيعان**: من خلال ملاحظة القيم العالية جدًا أو المنخفضة جدًا في المؤشر، يمكن للمتداول التعرف على أن السعر قد تحرك بشكل كبير بعيدًا عن متوسطه. قد يشير هذا إلى احتمال حدوث تصحيح (إذا كان يتوقع العودة إلى المتوسط) 🔄 أو أن هناك اختراقًا قويًا يحدث.
• **تأكيد الاتجاه**: المتوسط المتحرك لمقياس Z-Score والأشرطة المرتبطة به تتيح لك رؤية التغيرات في اتجاه سلوك السعر بالنسبة لمتوسطه. يمكن تفسير تقاطع أو تغير في هذه الخطوط كإشارة دخول 🛡️ أو خروج.
• **إدارة المخاطر**: من خلال معرفة مستويات الانحراف ومناطق الاحتمالية، يمكنك تعديل أحجام المراكز أو تحديد نقاط وقف الخسارة ⬇️ وجني الأرباح ⬆️، لأن لديك مرجعًا للحركات العادية مقابل الحركات الشاذة.
• **الفهم الإحصائي للسوق**: بخلاف كونه أداة رسومية فقط، يشجع هذا المؤشر على التفكير في سلوك السوق بمصطلحات احتمالية. معرفة "طبيعية" الحركة يمكن أن تكون عاملًا حاسمًا عند تقييم فرص التداول. 🎯
🌟 **الخاتمة** 🌟
يقوم هذا الخوارزم بتحويل بيانات السعر إلى تمثيل إحصائي يساعد على تصور وقياس انحراف السعر بالنسبة لسلوكه الأخير. من خلال الجمع بين مقياس Z-Score، المتوسط المتحرك، أشرطة الانحراف، وجدول الاحتمالية، يوفر المؤشر طبقات متعددة من المعلومات. هذا يجعله ذا قيمة خاصة لتحديد اللحظات التي يكون فيها السوق في ظروف غير عادية، مما يسهل اتخاذ قرارات الدخول 🚀، الخروج 🛑، وإدارة المخاطر بناءً على الاحتمالية والإحصائيات. 📈📉
مؤشرات متجر Ctrader:
هيكل السوق الديناميكي
تحليل نقاط الانعطاف
انحدار فيبوناتشي الخطي
انحدار متعدد الأطر الزمنية
انحياز الشمعة متعدد المستويات
المتعقب
الملخص
تقييمات العملاء
5 | 100 % | |
4 | 0 % | |
3 | 0 % | |
2 | 0 % | |
1 | 0 % |


