
Описание
Динамический поток тренда
Тип: осциллятор момента / тренда (в стиле MACD, многоцветный)
Что он делает
Динамический поток тренда — это цветной осциллятор момента, основанный на классической разнице между быстрым и медленным EMA плюс сигнальная линия.
Он помогает вам сразу увидеть:
- когда моментум бычий или медвежий,
- усиливается или ослабевает моментум,
- и где происходят сдвиги тренда (пересечения основной и сигнальной линии).
Индикатор рисует:
- Основная линия (линия потока)
-
- построена на разнице между быстрым и медленным EMA
- меняет цвет в зависимости от того, находится ли она выше или ниже сигнальной линии (опционально).
- Сигнальная линия
-
- скользящая средняя основной линии, используемая как более плавный триггер.
- Гистограмма с 4 цветами (опционально)
-
- показывает расстояние между основной и сигнальной линиями,
- цвет кодирует как направление (выше/ниже нуля), так и изменение силы от бара к бару.
- Точки на пересечениях (опционально)
-
- подсвечивают места пересечения основной линии с сигнальной → потенциальные изменения фаз тренда.
Все расчёты выполняются на текущем таймфрейме графика.
Как читать
1. Нулевая линия
- Значения выше нуля → доминирует бычье давление.
- Значения ниже нуля → доминирует медвежье давление.
2. Цветная гистограмма
При включенном режиме 4 цвета:
- Аква → выше нуля и растёт
-
- сильный / растущий бычий моментум.
- Синий → выше нуля, но падает
-
- бычий тренд ещё продолжается, но моментум охлаждается.
- Красный → ниже нуля и падает
-
- сильный / растущий медвежий моментум.
- Бордовый → ниже нуля, но растёт
-
- медвежья фаза ещё продолжается, но моментум теряет силу.
Это значительно облегчает визуальное обнаружение дивергенций и сдвигов моментума.
3. Основная и сигнальная линии
- Основная линия выше сигнала → бычья фаза.
- Основная линия ниже сигнала → медвежья фаза.
Если включена смена цвета:
- Основная линия Лайм = выше сигнала (бычий контроль)
- Основная линия Красная = ниже сигнала (медвежий контроль)
4. Точки на пересечениях
- Зелёная точка (пересечение вверх) → основная линия пересекает сигнал сверху
-
- возможное начало бычьего движения.
- Красная точка (пересечение вниз) → основная линия пересекает сигнал снизу
-
- возможное начало медвежьего движения.
Всегда сочетайте эти сигналы с анализом структуры / ценового действия и контекстом старших таймфреймов.
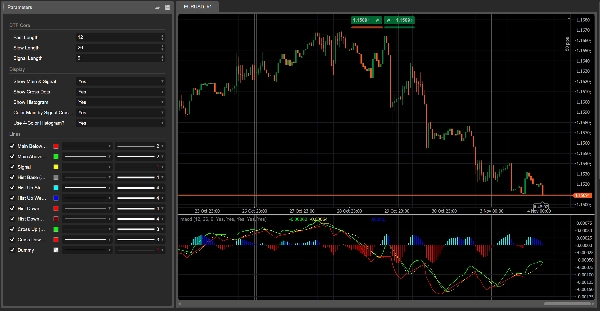
Параметры (английский)
Основной модуль DTF
- Период быстрого EMA – период быстрого EMA (по умолчанию 12).
- Период медленного EMA – период медленного EMA (по умолчанию 26).
- Период сигнальной линии – период сигнальной SMA, применяемой к основной линии (по умолчанию 9).
Отображение
- Показать основную и сигнальную линии – переключает отображение двух линий.
- Показать точки на пересечениях – отображает точки на пересечениях основной и сигнальной линий.
- Показать гистограмму – переключает отображение гистограммы позади.
- Цвет основной линии по пересечению с сигналом?
-
- ВКЛ → основная линия Лайм выше сигнала, Красная ниже.
- ВЫКЛ → основная линия остаётся Красной.
- Использовать 4-цветную гистограмму?
-
- ВКЛ → логика aqua / синий / красный / бордовый.
- ВЫКЛ → гистограмма одного серого цвета.
Сводка
Отзывы покупателей
5 | 0 % | |
4 | 100 % | |
3 | 0 % | |
2 | 0 % | |
1 | 0 % |


