
说明
趋势回撤分析器
趋势回撤分析器 是一个 cTrader 指标,用于通过测量回撤的深度和频率来分析趋势的 呼吸 —— 现在也以 斐波那契回撤百分比 显示。
使用基于 EMA 的趋势过滤器,该指标:
- 检测何时存在明显的 上升趋势 或 下降趋势;
- 识别该趋势中的每个 确认回撤;
- 测量 回撤深度(点数);
- 计算相对于最后一个冲击波段的 斐波那契式回撤百分比;
- 实时跟踪:
-
- 当前趋势中发生了多少次回撤,
- 最后一次回撤深度,
- 平均回撤深度,
- 最后一次斐波那契回撤百分比。
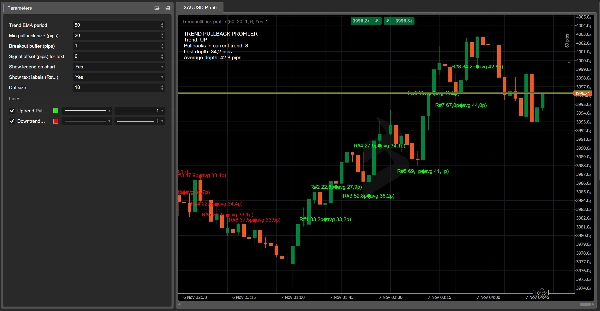
在图表上,它:
- 在上升趋势的回撤低点绘制一个 大绿色点,
- 在下降趋势的回撤高点绘制一个 大红色点,
- 可选地打印一个紧凑的标签,如:
22.5 p / 38.2%。
在左上角,动态图例显示:
- 当前趋势方向(上升 / 下降 / 无);
- 当前趋势中的回撤次数;
- 最后一次回撤深度(点数);
- 平均回撤深度(点数);
- 最后一次 斐波那契回撤百分比。
关键参数
- 趋势 EMA 周期
用于定义趋势方向的 EMA 周期。 - 最小回撤大小(点数)
计为有效回撤所需的最小回撤深度(点数)。 - 突破缓冲区(点数)
价格必须超出前一个趋势极值的额外距离,以确认新波段并结束回撤。 - 文本信号偏移(点数)
文本标签相对于回撤高点/低点的垂直偏移。 - 在图表上显示图例
切换图表上的趋势、最后和平均指标图例。 - 在点附近显示文本标签
启用时,在点旁打印一个小标签,显示回撤深度(以及可选的斐波那契百分比)。 - 标签中显示斐波那契百分比
启用时,标签中同时显示点数和斐波那契百分比(XX.Xp / YY.Y%)。 - 点大小
控制图表上点的大小,使回撤即使在较低时间框架上也易于识别。
实际使用案例
- 直观分析特定品种/时间框架上的回撤深度。
- 围绕 典型 回撤区规划限价入场,而非随机水平。
- 发现异常深的回撤(例如超过 61.8% 或 78.6%),这可能预示 趋势疲软或可能的反转。
- 为您的趋势交易手册添加客观、数字化的回撤和斐波那契信息。
趋势回撤分析器中斐波那契回撤的计算方法
趋势回撤分析器基于 趋势的最后一个冲击波段 计算斐波那契式回撤百分比,而非任意高低点。
在上升趋势中
- 指标跟踪一个 冲击波段,起点为:
-
- 趋势基准价 = 上一个重要低点(上一次回撤结束)
- 趋势极值 = 趋势的最后一个摆动高点
- 当形成回撤时,指标测量:
-
- 回撤深度(价格):
depthPrice = trendHigh – pullbackLow - 冲击波段大小:
legSize = trendHigh – trendBasePrice
- 回撤深度(价格):
- 斐波那契回撤百分比为:
Fib% = (depthPrice / legSize) * 100
因此,如果价格回撤大约为最后一次冲击的 38.2%–50% 后继续上涨,您将看到接近 38.2%、50%、61.8% 等值。
在下降趋势中
- 冲击波段从:
-
- 趋势基准价 = 上一个重要高点(上一次回撤结束)
- 趋势极值 = 趋势的最后一个摆动低点
- 回撤向 上方逆势移动,指标测量:
-
- 回撤深度(价格):
depthPrice = pullbackHigh – trendLow - 冲击波段大小:
legSize = trendBasePrice – trendLow
- 回撤深度(价格):
- 公式相同:
Fib% = (depthPrice / legSize) * 100
这样,您在图表上看到的每个点都代表 当前趋势中明确冲击波段内的回撤,以 点数 和 斐波那契百分比 表达,方便您快速判断回撤是浅显、典型还是异常深。
摘要
AI 摘要
Trend Pullback Profiler is a cTrader indicator designed to analyze trend behavior by measuring the depth and frequency of pullbacks within a trend. It uses an EMA-based filter to detect clear uptrends or downtrends and identifies confirmed pullbacks during these trends. The indicator measures pullback depth in pips and calculates Fibonacci-style retracement percentages relative to the last impulse leg of the trend.
Key features include:
- Detection of trend direction and pullbacks.
- Measurement of pullback depth and Fibonacci retracement percentage.
- Live tracking of the number of pullbacks, last pullback depth, average pullback depth, and last Fibonacci retracement percentage.
- Visual chart elements such as large green dots at pullback lows in uptrends and large red dots at pullback highs in downtrends.
- Optional compact labels displaying pullback depth and Fibonacci percentage.
- A dynamic legend showing current trend direction, pullback counts, and metrics.
The Fibonacci retracement is calculated based on the last impulse leg, defined by the last significant trend base and extreme prices, providing objective numeric data to assess whether retracements are shallow, typical, or unusually deep. The indicator supports various markets including Forex, indices, commodities, cryptocurrencies, and stocks. It offers configurable parameters such as EMA period, minimum pullback size, breakout buffer, and display options for labels and legend.
指标配置
客户评价
4.5
评价:2
5 | 50 % | |
4 | 50 % | |
3 | 0 % | |
2 | 0 % | |
1 | 0 % |
客户评价
November 10, 2025
tested small first and that felt like the right move, and it is just a support layer.
November 10, 2025
讨论
常见问答
BTCUSD
Forex
Signal
Breakout
Indices
EURUSD
Commodities
GBPUSD
NZDUSD
RSI
Martingale
Fibonacci
Prop
Scalping
SMC
Crypto
Grid
Stocks
AI
XAUUSD
NAS100
ATR
USDJPY
cTrader Store 提供的所有产品,包括交易机器人、指标和插件,均由第三方开发者提供,仅供信息参考和技术访问之用。cTrader Store 并非经纪商,不提供投资建议、个人推荐或任何未来业绩保证。


价格
42.11M
交易量
6.13M
盈利点数
228
销售
8.47K
免费安装