説明
流動性ヒートマップ - プロフェッショナルなマルチタイムフレームピボット分析
高度な流動性の可視化でトレードを変革しましょう。この強力なインジケーターは、10の異なるタイムフレームのピボットポイントを同時に分析することで機関投資家の流動性ゾーンを明らかにし、スマートマネーがどこに位置しているかを正確に示す動的なヒートマップを作成します。
仕組み
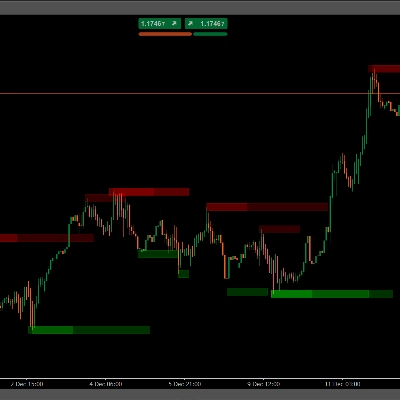
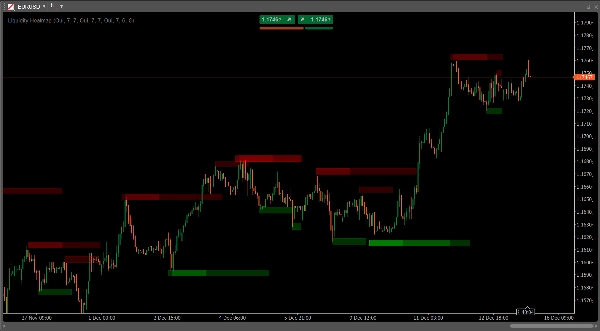
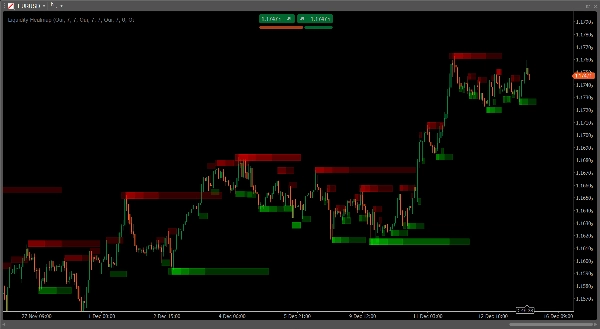
このインジケーターは複数のタイムフレーム(15分、30分、1時間、2時間、4時間、日足、8時間、3日、週足、月足)でピボットの高値と安値を検出し、それぞれのピボットレベルに半透明のゾーンを重ねます。異なるタイムフレームの複数のピボットが収束する場所では、ゾーンが重なり色が濃くなり、チャート上で最も強力な流動性レベルを示す「ヒートシグネチャー」を作り出します。
主な特徴
- 10のカスタマイズ可能なタイムフレーム:15分の短期から月足の長期まで同時に分析可能
- インテリジェントな密度マッピング:重なり合うゾーンが自動的に濃くなり、流動性の集積を示します
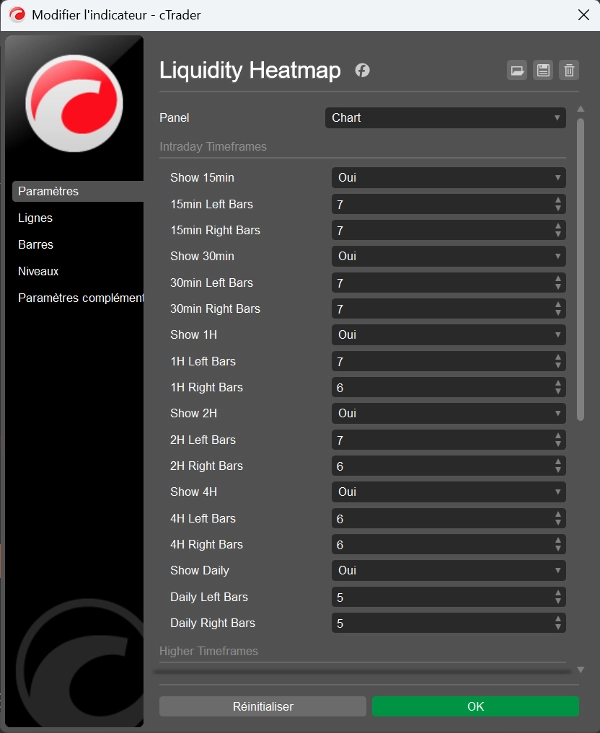
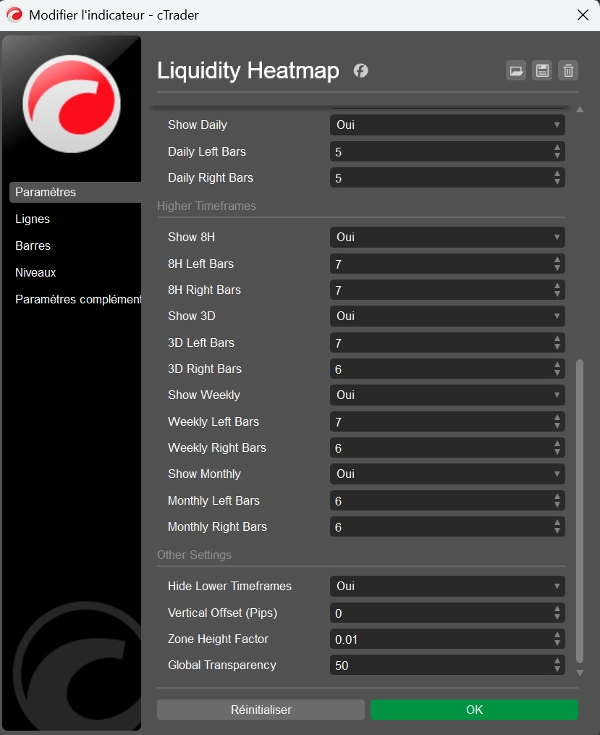
- 完全に調整可能なピボット検出:各タイムフレームごとに左右のバー数(2~20)を独立して設定可能
- 適応型ビジュアライゼーション:チャートのズームに合わせてゾーンの高さが自動調整され、一貫した表示を実現
- 時間に固定されたゾーン:ゾーンは形成された正確な時間に固定され、チャート上で移動しません
- カスタマイズ可能な透明度:チャートスタイルに合わせてグローバル透明度(0~255)を調整可能
- スマートなタイムフレームフィルタリング:現在のチャートビューに基づき、下位タイムフレームを非表示にするオプション
- 垂直オフセット制御:ピップ単位でゾーンの位置を微調整可能
- 色分けの区別:ピボット高値(レジスタンス)は赤、ピボット安値(サポート)は緑で表示
こんな方に最適
- 流動性プールを特定するスマートマネーコンセプト(SMC)トレーダー
- 機関レベルを追跡するICTメソッド論のフォロワー
- 高確率の反転ゾーンを見つけるスイングトレーダー
- 日中の流動性獲得を特定するスキャルパー
- 複数のタイムフレームでの合流点を求めるすべてのトレーダー
トレーディングへの応用
ヒートマップはストップロスが集中する場所や機関の注文が存在する可能性のある場所を明らかにします。これらのゾーンを使って:
- 流動性のスイープや反転を予測する
- 強力なサポート/レジスタンスの合流点を特定する
- 流動性獲得後の最適なエントリーポイントを見つける
- 重要な流動性ゾーンの先に戦略的なストップロスを設定する
- 流動性消費を観察してブレイクアウトの有効性を確認する
このインジケーターが際立つ理由
単一のタイムフレームレベルを示す基本的なピボットインジケーターとは異なり、このヒートマップは10のタイムフレームからのデータを同時に集約し、市場構造の包括的なビューを提供します。密度の可視化により、どのレベルが最も重要かが即座にわかります。ゾーンが濃いほど、多くのタイムフレームがその流動性レベルに同意していることを示します。
パフォーマンス最適化
スマートなオブジェクト管理により、各タイムフレームで最大500本のバーを効率的に処理し、すべてのタイムフレームを有効にしてもスムーズなチャートパフォーマンスを保証します。
簡単セットアップ
最適化されたデフォルト設定でインストール後すぐにトレードを開始でき、または特定の戦略やトレーディングスタイルに合わせてすべてのパラメーターをカスタマイズ可能です。
流動性分析を高め、機関の注文フローの洞察を持ってトレードしましょう。価格はランダムに動くのではなく、流動性に向かって動くことを理解しているトレーダーに最適です。
概要
Key features include customizable pivot detection parameters for each timeframe, adaptive zone visualization that scales with chart zoom, and separate color coding for resistance (red) and support (green) zones. The indicator also offers adjustable transparency, vertical offset control, and smart timeframe filtering to hide lower timeframes based on the current chart view.
This tool is suitable for traders using Smart Money Concepts, ICT methodology, swing trading, scalping, or any strategy requiring multi-timeframe liquidity analysis. It helps identify clusters of stop losses and institutional orders to anticipate liquidity sweeps, reversals, strong support/resistance levels, optimal entry points, strategic stop losses, and breakout confirmations.
Liquidity Heatmap efficiently processes up to 500 bars per timeframe with optimized object management, ensuring smooth performance. It supports various markets including Forex, Crypto, Stocks, Indices, and Commodities. The indicator comes with optimized default settings and full customization options to fit different trading styles.
カスタマーレビュー
5 | 100 % | |
4 | 0 % | |
3 | 0 % | |
2 | 0 % | |
1 | 0 % |


