Описание
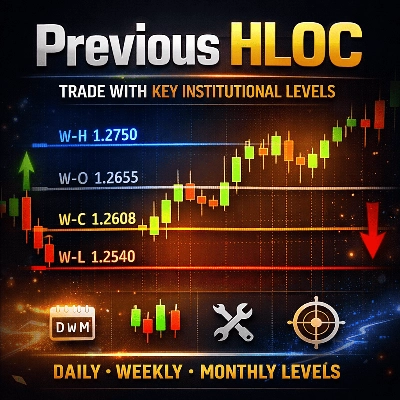
Previous HLOC – умные уровни более высокого таймфрейма для точной торговли
Previous HLOC — профессиональный индикатор с множеством таймфреймов, который отображает уровни High, Low, Open и Close предыдущего периода непосредственно на вашем графике с непревзойденной четкостью и возможностями настройки.
Разработан для трейдеров, работающих с ценовым действием, скальперов, внутридневных трейдеров и свинг-трейдеров, этот индикатор помогает мгновенно определить ключевые институциональные уровни, которые часто выступают в роли зон поддержки, сопротивления, отторжения и целей ликвидности.
Почему Previous HLOC?
Рынки постоянно реагируют на уровни предыдущего дня, недели и месяца. Институции, алгоритмы и профессиональные трейдеры внимательно отслеживают эти уровни.
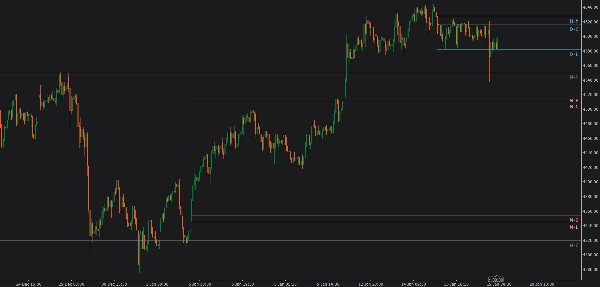
Previous HLOC выводит эти критические цены на ваш график в чистом, не отвлекающем формате — чтобы вы никогда их не пропустили.
Ключевые особенности
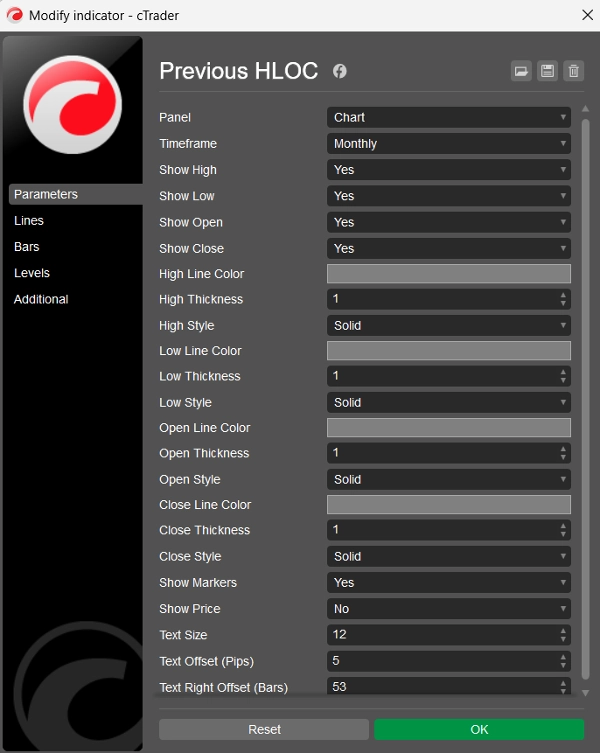
✅ Многоуровневые таймфреймы
- Выбирайте уровни предыдущей свечи: дневные, недельные, месячные или часовые
- Уровни остаются точными независимо от таймфрейма вашего графика
✅ Полный контроль HLOC
- Включайте или отключайте High, Low, Open, Close по отдельности
- Торгуйте только тем, что важно для вашей стратегии
✅ Расширенные настройки
- Отдельно настраивайте цвет, толщину и стиль линии для каждого уровня
- Чистые маркировки шрифтом Consolas с регулируемым размером текста
- Опциональное отображение цены рядом с каждой маркировкой
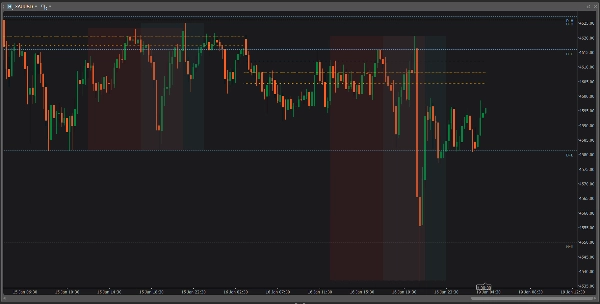
✅ Умные плавающие маркеры
- Маркеры движутся естественно вместе с графиком
- Всегда остаются выровненными по ценовому уровню при прокрутке
- Расположены с правой стороны для лучшей видимости
✅ Проецируемые уровни в будущее
- Линии простираются далеко в будущее
- Идеально подходит для планирования входов, выходов, стоп-лоссов и тейк-профитов
🔹 Как трейдеры используют этот индикатор
📌 Определяйте сильные внутридневные уровни поддержки и сопротивления
📌 Используйте предыдущие High/Low как зоны ликвидности для смахивания
📌 Торгуйте пробои, отторжения и ретесты
📌 Совмещайте входы с настроем более высокого таймфрейма
📌 Повышайте точность соотношения риск/прибыль
🔹 Для кого этот индикатор?
✔ Форекс трейдеры
✔ Трейдеры индексов и товаров
✔ Скальперы и внутридневные трейдеры
✔ Свинг-трейдеры
✔ Трейдеры, работающие с ценовым действием и SMC
🔹 Чисто. Быстро. Надежно.
- Без перерисовки
- Без задержек
- Без загромождения
- Работает на всех символах и всех таймфреймах
🔹 Итог
Previous HLOC — это не просто индикатор уровней, это профессиональный торговый инструмент, который помогает торговать с контекстом, структурой и уверенностью.
Если вы торгуете вокруг уровней предыдущей сессии, этот индикатор должен быть на вашем графике.
Сводка
Отзывы покупателей
5 | 100 % | |
4 | 0 % | |
3 | 0 % | |
2 | 0 % | |
1 | 0 % |


