
Описание
ЧТО ОН ДЕЛАЕТ
Auto-Draw Fibonacci Suite автоматически обнаруживает структуры колебаний и одновременно рисует семь геометрических инструментов— четыре инструмента Фибоначчи плюс три дополнительных инструмента геометрического анализа —без необходимости ручного размещения.
Традиционный анализ Фибоначчи означает определение колебаний, построение уровней коррекции, повторное построение вееров от тех же колебаний, ручное размещение вилок, настройку временных зон. Каждый инструмент требует отдельной настройки. Каждое новое колебание означает перерисовку всего.
Этот индикатор автоматизирует весь этот процесс.
Колебания обнаруживаются один раз с помощью метода регрессии. Все семь геометрических инструментов — уровни коррекции Фибоначчи, расширение, веер и временные зоны, а также вилка Эндрюса, эквидистантный канал и веер Ганна — автоматически ссылаются на те же точки колебаний.
Когда цена формирует новое колебание, каждый активный инструмент обновляется в реальном времени. Без перерисовки. Без ручного выбора колебаний. Без геометрической несогласованности из-за использования разных опорных точек в разных инструментах.
ОСНОВНОЕ ПРЕИМУЩЕСТВО
Ручной подход:
- Визуально определить максимум и минимум колебания
- Построить уровни коррекции Фибоначчи
- Снова определить те же колебания, построить веер
- Найти три колебания, вручную разместить вилку
- Цена формирует новое колебание → повторить весь процесс
Подход Auto-Draw:
- Индикатор автоматически обнаруживает колебания
- Все семь инструментов рисуются и обновляются самостоятельно
- Цена формирует новое колебание → всё обновляется автоматически
- Разница структурная. Вместо семи отдельных ручных процессов у вас есть одна автоматизированная система обнаружения, проецирующаяся на все геометрические области — инструменты на основе Фибоначчи для анализа соотношений и три дополнительных геометрических фреймворка для комплексного картирования структуры рынка.
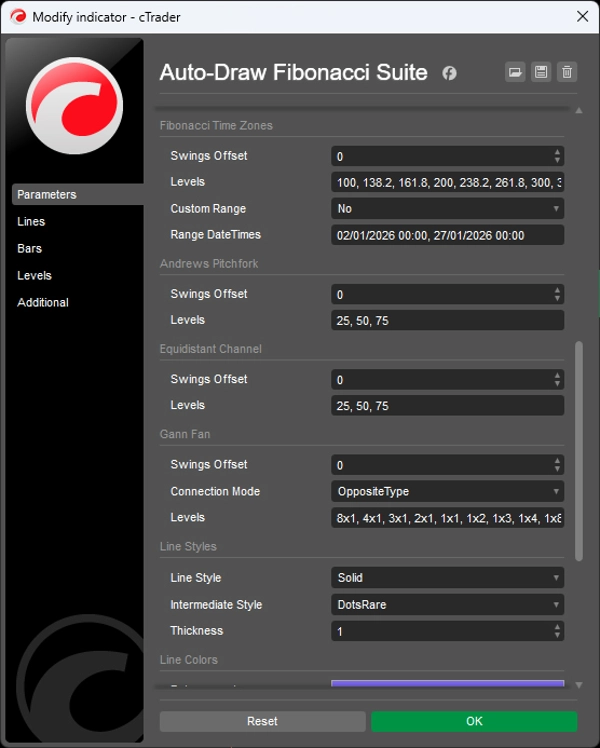
НАБОР ИНСТРУМЕНТОВ
Четыре инструмента Фибоначчи:
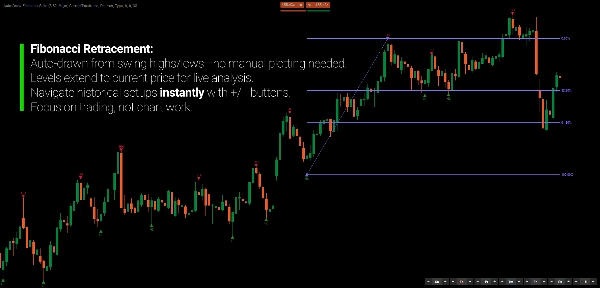
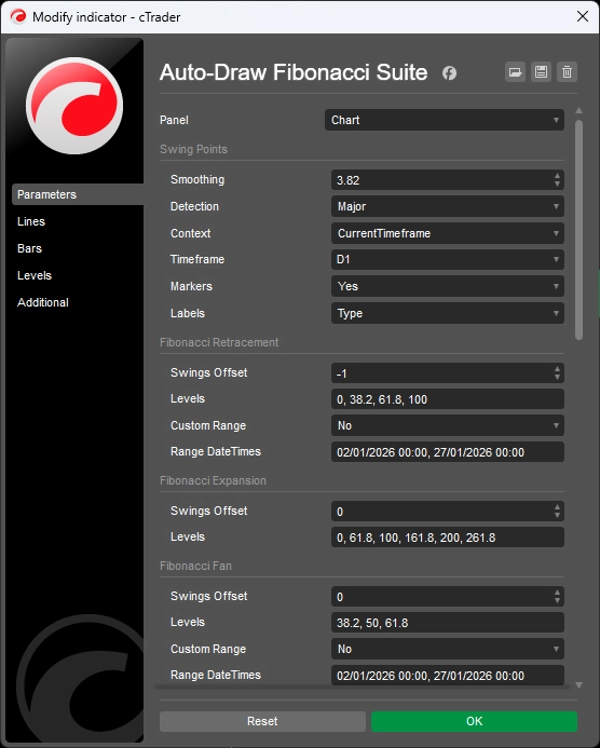
- Уровни коррекции Фибоначчи — горизонтальные уровни (0%, 38.2%, 61.8%, 100%)
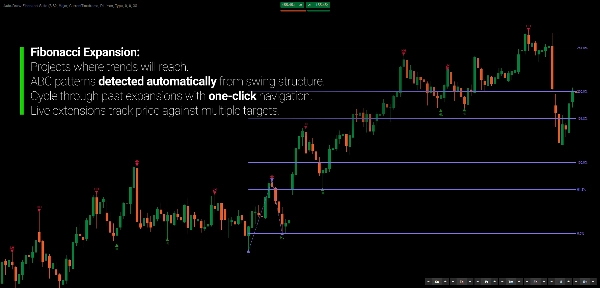
- Расширение Фибоначчи — проекционные цели за пределами третьего колебания
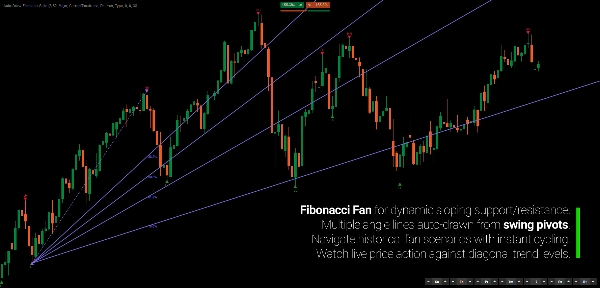
- Веер Фибоначчи — диагональные трендовые линии от опорных точек
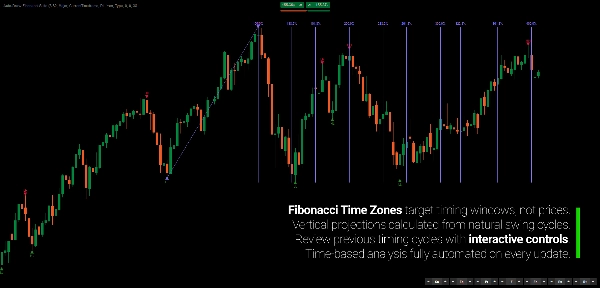
- Временные зоны Фибоначчи — вертикальная временная проекция
Три дополнительных геометрических инструмента:
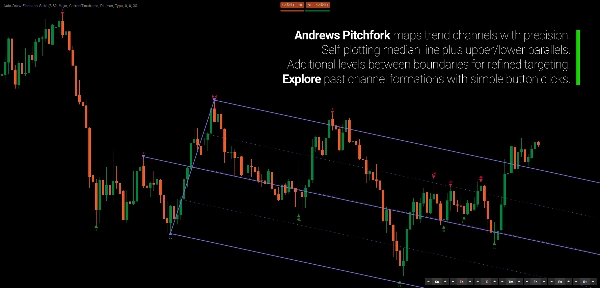
- Вилка Эндрюса — трёхточечная медиана с параллельными каналами
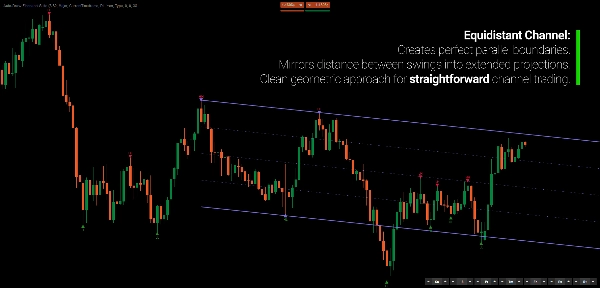
- Эквидистантный канал — параллельный канал с промежуточными уровнями
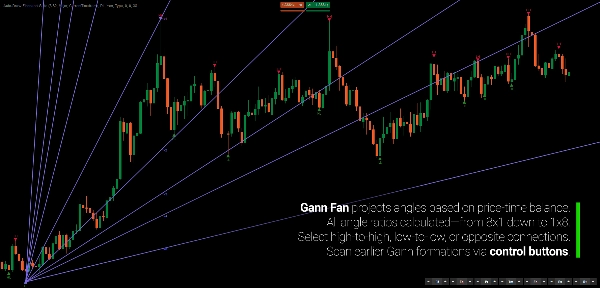
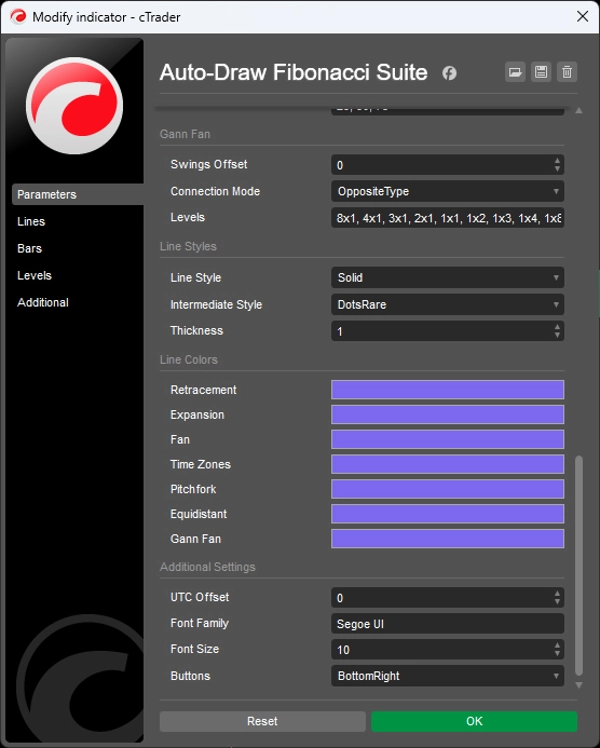
- Веер Ганна — проекции углов цена-время (8x1, 4x1, 2x1, 1x1, 1x2…)
Каждый инструмент можно включать независимо. Все они ссылаются на одно и то же базовое обнаружение колебаний.
ЕДИНЫЙ ОБНАРУЖИТЕЛЬ КОЛЕБАНИЙ
Три режима обнаружения контролируют чувствительность к колебаниям:
- Основной — меньше, но сильнее колебаний (подтверждённых закрытиями)
- Стандартный — сбалансированная детализация (наиболее распространённый)
- Второстепенный — обнаруживает внутренние колебания внутри трендов (максимальная детализация)
Колебания автоматически классифицируются (HH/LL/LH/HL) и измеряются по глубине, объёму и продолжительности. Визуальные маркеры показывают подтверждённые колебания (треугольники), неподтверждённые (круги) и внутренние колебания (квадраты).
ИНТЕРАКТИВНЫЕ КОНТРОЛИ СМЕЩЕНИЯ
Семь групп кнопок (по одной на инструмент) позволяют мгновенно регулировать, какие исторические колебания использует каждая геометрическая проекция:
- 0 — последняя структура колебаний
- -1 — предыдущая структура
- -2 — две структуры назад
Пробегайте назад по истории колебаний, чтобы увидеть, как геометрические отношения развивались в предыдущих структурных точках. Меняйте опорные колебания любого инструмента без влияния на другие.
ПОДДЕРЖКА МНОГОТАЙМФРЕЙМОВ
Применяйте обнаружение колебаний к более высокому таймфрейму, просматривая график на более низком таймфрейме. Видьте дневные колебания и все геометрические проекции на вашем графике H1 — переключение таймфреймов не требуется.
КЛЮЧЕВЫЕ ОСОБЕННОСТИ
- Автоматическое обнаружение колебаний с помощью метода регрессии
- Семь геометрических инструментов, автоматически построенных на основе единого обнаружения колебаний
- Обновления в реальном времени при формировании новых колебаний
- Интерактивные элементы управления смещением для каждого инструмента
- Режим мульти-таймфрейма (анализ дневных данных, торговля на H1)
- Три режима обнаружения (Основной/Стандартный/Второстепенный)
- Классификация колебаний (HH/LL/LH/HL) и метрики
- Умное группирование колебаний (устраняет избыточные промежуточные колебания)
- Полностью настраиваемые уровни, цвета, стили
- Выделенные исходные колебания для активных инструментов
ДЛЯ КОГО ЭТО
Этот индикатор предназначен для трейдеров, которые понимают инструменты анализа Фибоначчи и геометрии, но не хотят тратить время на их ручное размещение и перерисовку.
Если вы используете несколько проекций Фибоначчи и постоянно перерисовываете их по мере развития цены — или избегаете некоторых инструментов из-за утомительной ручной настройки — этот набор автоматизирует этот процесс.
Он хорошо подходит для свинг- и позиционных трейдеров, которым нужна геометрическая опора в нескольких инструментах, аналитиков мульти-таймфреймов, желающих видеть структуру более высокого таймфрейма на графиках исполнения, и дискреционных трейдеров, ценящих геометрическое совпадение, но не желающих тратить время на ручное управление инструментами.
Это не система сигналов. Это инструмент автоматизации для трейдеров, которые уже мыслят в терминах Фибоначчи и геометрии и хотят, чтобы их анализ обновлялся самостоятельно.
ЧТО ДЕЛАЕТ ЕГО ОСОБЕННЫМ
Большинство индикаторов геометрического анализа рисуют один тип инструмента. Этот набор рисует семь одновременно на основе единого обнаружения колебаний.
Большинство требуют ручного выбора колебаний. Этот автоматизирует идентификацию колебаний и обновляет все инструменты в реальном времени.
Большинство рассматривают каждый инструмент отдельно. Этот поддерживает геометрическую согласованность, обеспечивая, чтобы все проекции ссылались на одни и те же базовые структуры.
Результат: полный многофреймовый геометрический анализ без постоянной перерисовки.
---
ПОНИМАНИЕ ФИБОНАЧЧИ КАК ГЕОМЕТРИЧЕСКОГО ЯЗЫКА
Анализ Фибоначчи часто неправильно понимают как предсказательный — будто рынки "уважают" определённые соотношения. Это упускает из виду фундаментальный принцип.
Соотношения Фибоначчи не предсказывают, куда пойдёт цена. Они предоставляют стандартизованный геометрический словарь для описания того, как цена движется относительно предыдущей структуры. Коррекция до 61.8% представляет собой геометрическую связь между текущей коррекцией и предыдущим импульсом — а не "поддержку" в причинном смысле.
Ценность заключается в геометрической согласованности, а не в отдельных уровнях. Когда несколько проекций сходятся — уровень коррекции совпадает с углом веера и временной зоной — это отражает структурную согласованность в разных измерительных областях.
Рынки не нацелены на уровни Фибоначчи. Когда геометрические проекции совпадают, это совпадение раскрывает лежащий в основе структурный порядок. Вот почему изолированные уровни имеют ограниченную ценность, тогда как сходящиеся геометрические структуры часто отмечают точки перегиба.
Геометрия не является причиной. Это описательный язык структурных отношений.
---
Торговля связана с риском. Этот индикатор — инструмент технического анализа — всегда применяйте надлежащее управление рисками.


