
ЧТО ОН ДЕЛАЕТ
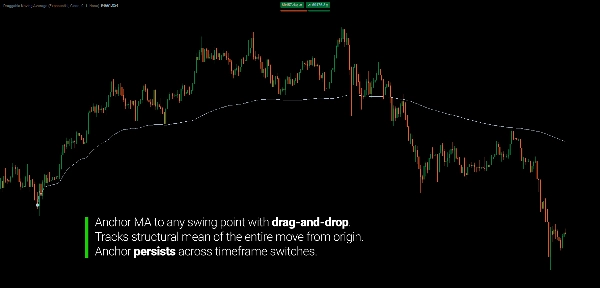
Draggable Moving Average закрепляет скользящую среднюю за любой точкой в истории цен — не с бара ноль, не с фиксированного периода, а именно там, где вы её разместите.
Стандартные скользящие средние начинаются с начала данных графика и со временем сходятся. Их период фиксирован. Их начальная точка произвольна. Когда вы хотите измерить, как цена изменилась с момента конкретного структурного события — начала коррекции, начала импульса, ключевого поворота — нет способа закрепить MA именно в этот момент.
Этот индикатор решает эту проблему.
Разместите иконку якоря на любом баре. MA начинается с этого бара и продолжается вперёд. Перетащите иконку на другой бар — MA мгновенно пересчитывается с новой позиции. Переключайтесь между таймфреймами — якорь сохраняется, MA автоматически пересчитывается на новом графике.
В результате получается скользящая средняя, которая всегда отражает, как цена изменилась с конкретной структурной точки, которую вы определяете.
ОСНОВНОЕ ПРЕИМУЩЕСТВО
Стандартный подход:
- Определить начало коррекционного или импульсного движения
- Применить MA с фиксированным периодом — он начинается с начала графика, а не с вашей структуры
- Ручная корректировка периода для приближения длины структуры
- Переключение таймфреймов — период теряет смысл при разном количестве баров
- Повторять каждый раз при изменении структуры
Подход с перетаскиваемым якорем:
- Разместить якорь в начале структуры
- MA рассчитывается вперёд от этого точного бара
- Переключение таймфреймов — якорь сохраняется, MA пересчитывается автоматически
- Перетаскивание для корректировки — всё обновляется мгновенно
Разница структурная. Вместо приближения точки отсчёта через корректировку периода вы задаёте её напрямую. Структурная точка — это входные данные, а не период.
ЗАКРЕПЛЕНО ЗА СТРУКТУРОЙ: ОБНАРУЖЕНИЕ СРЕДНЕГО ЗНАЧЕНИЯ И РАЗВОРОТА
Когда скользящая средняя начинается с точки структурного поворота — начала тренда, начала импульса или начала коррекции — она перестаёт быть произвольной линией сглаживания и начинает вести себя как структурное среднее.
Цена организуется вокруг этого среднего предсказуемым образом:
- Во время движения цена колеблется вокруг закреплённого MA — отдаляясь во время импульсов, возвращаясь к MA во время консолидации. MA отражает среднюю цену всей структуры с её начала, а не только последних баров.
- При истощении цена начинает пересекать закреплённый MA, а не отскакивать от него. Закрытие ниже восходящего закреплённого MA — который отслеживал импульс с его начала — имеет структурное значение. Нарушается среднее значение всего движения.
- После разворота закреплённый MA становится сопротивлением. Повторные тесты MA снизу отмечают логичные зоны, где предыдущее структурное среднее выступает как предложение.
Это поведение последовательно, потому что MA измеряет правильную величину: среднюю цену конкретного структурного движения от его реальной начальной точки, а не от произвольного периода назад.
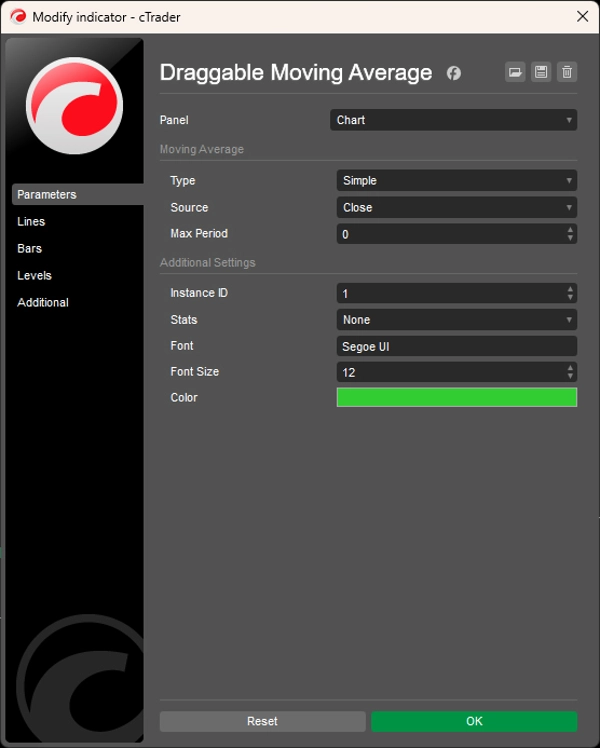
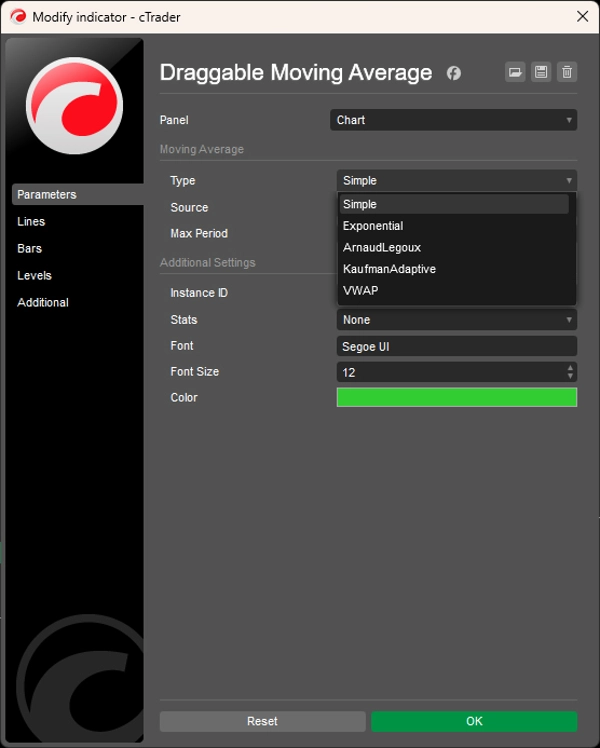
ПОДДЕРЖИВАЕМЫЕ ТИПЫ MA
Пять методов расчёта, выбираемых для каждого экземпляра:
- Простая (SMA) — арифметическое среднее от якоря вперёд; растёт с каждым баром до достижения Max Period
- Экспоненциальная (EMA) — с экспоненциальным взвешиванием; более чувствительна к последним ценовым изменениям
- Arnaud Legoux (ALMA) — с гауссовским взвешиванием; уменьшает запаздывание без усиления шума
- Kaufman Adaptive (KAMA) — динамически регулирует сглаживание на основе коэффициента эффективности рынка; сужается в тренде, расширяется при консолидации
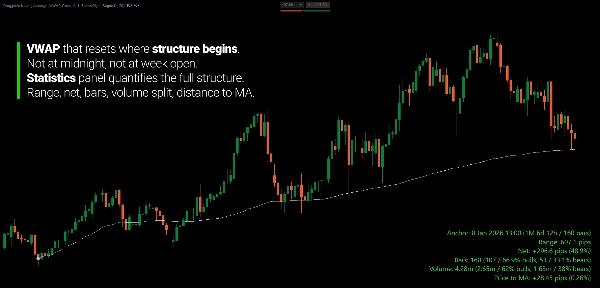
- VWAP — средневзвешенная по объёму от якоря; отражает, где сосредоточен основной объём с момента структурной точки
Все типы учитывают параметр Max Period — ограничивают окно просмотра, сохраняя якорь в качестве точки отсчёта.
ПАНЕЛЬ СТАТИСТИКИ
Опциональная панель наложения, выбираемая в одном из четырёх углов, отображает в реальном времени метрики от якоря до текущего бара:
- Диапазон в пипсах (максимум к минимуму)
- Чистое изменение в пипсах и процентах
- Общее количество баров с подсчётом и процентами бычьих/медвежьих
- Общий объём с разделением и процентами бычьего/медвежьего объёма
- Текущее расстояние цены от MA в пипсах и процентах
- Продолжительность и счётчик баров от якорного до текущего бара
Полезно для точного количественного описания структуры, к которой вы закрепились — не только линии MA, но и полного статистического профиля ценового движения от начала до текущего момента.
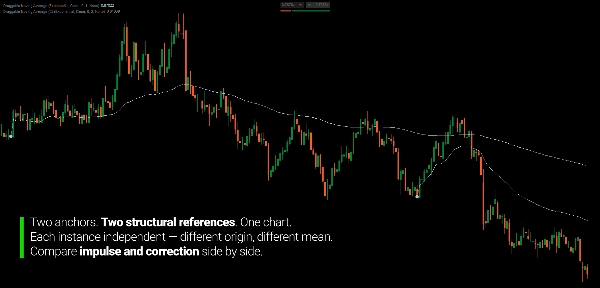
ПОДДЕРЖКА МНОЖЕСТВЕННЫХ ЭКЗЕМПЛЯРОВ
Каждый экземпляр имеет уникальный ID. Несколько экземпляров могут работать одновременно — один закреплён на начале коррекции, другой — на предыдущем импульсе — без конфликтов иконок или меток.
КЛЮЧЕВЫЕ ОСОБЕННОСТИ
- Перетаскиваемая иконка якоря — разместите на любом баре, перетащите для корректировки, MA обновляется мгновенно
- Пять типов MA (SMA, EMA, ALMA, KAMA, VWAP)
- Восемь источников цены (Open, High, Low, Close, Average, Median, Typical, Weighted)
- Ограничение Max Period с прокручивающимся окном от якоря
- Опциональная панель статистики с четырьмя позициями в углах
- Поддержка нескольких экземпляров с уникальными ID
- Постоянный якорь при переключении таймфреймов
ДЛЯ КОГО ОН ПРЕДНАЗНАЧЕН
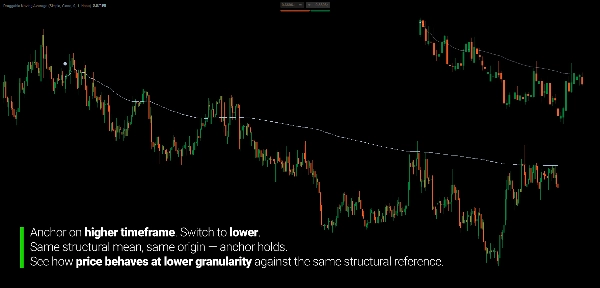
Этот индикатор предназначен для трейдеров, которые анализируют структуру рынка на разных таймфреймах — особенно тех, кто хочет измерять поведение цены от определённой структурной точки, а не от произвольного периода назад.
Если вы анализируете коррекционные и импульсные участки на старших таймфреймах и хотите оценить ту же структуру с более детальной точностью на младших, перетаскиваемый якорь позволяет один раз отметить структурную начальную точку и переносить её между таймфреймами. Закрепите на дневном графике, переключитесь на M15 — ссылка сохраняется.
Он подходит свинг- и позиционным трейдерам, которые мыслят структурными движениями, а не фиксированными периодами, мульти-таймфрейм аналитикам, которым нужны стабильные точки отсчёта на разных графиках, и дискреционным трейдерам, желающим точного, пользовательского закрепления MA без угадывания периода.
Это не сигнальная система. Это инструмент структурного измерения для трейдеров, которые уже мыслят в терминах ценовых движений и хотят, чтобы их скользящая средняя точно отражала эти движения.
ЧЕМ ОН ОТЛИЧАЕТСЯ
Стандартные скользящие средние основаны на периодах. Их ссылка подразумевается — n баров назад от текущего. Когда структурное движение заканчивается и начинается новое, период теряет смысл. Нельзя направить стандартный MA на конкретное событие.
Этот индикатор делает ссылку явной. Вы закрепляетесь за структурным событием. MA измеряет оттуда. Период не является входным параметром — структурная точка является.
Результат: скользящая средняя, отражающая ваш реальный структурный анализ, а не его приближение.
---
ПОНИМАНИЕ СКОЛЬЗЯЩЕЙ СРЕДНЕЙ КАК СТРУКТУРНОГО СРЕДНЕГО
Скользящие средние часто неправильно понимают как уровни поддержки и сопротивления. Трейдеры ждут, что цена «будет уважать» 50 MA или отскочит от 200 MA, как будто эти числа имеют внутреннее значение для рынка. Это не так.
Скользящая средняя — это арифметическое описание распределения — средняя цена за определённый период. Значимость этой линии определяется не формулой, а тем, имеет ли измеряемое окно структурное значение.
Вот почему периодные MA имеют фундаментальные ограничения. 50-периодный MA измеряет последние 50 баров — окно, не связанное с каким-либо структурным событием. Оно не соответствует началу тренда или началу коррекции. Это скользящее окно произвольной длины, положение которого определяется только актуальностью.
Когда вы закрепляетесь за структурной точкой поворота, MA становится средним конкретного, связного ценового распределения от этой точки вперёд. Когда цена сильно отклоняется вверх, участники, вошедшие в точке начала, находятся в прибыли. Когда цена возвращается к MA, это отражает ребалансировку распределения. Когда цена пробивает MA чисто, средний участник от структурного начала находится в безубыточности или убытке — это изменение статистического режима, а не просто пробой линии.
Геометрия не является причиной. Это статистическое описание структурного распределения, границы которого вы определили.
---
Торговля связана с риском. Этот индикатор является инструментом технического анализа — всегда применяйте надлежащее управление рисками.


