

Description
EWO PRO (Oscillateur de Vagues d'Elliott)
L'EWO est un outil précieux pour les traders cherchant à obtenir une vue d'ensemble du marché et à prendre des décisions éclairées.
1) SYSTÈME DE TRADING :
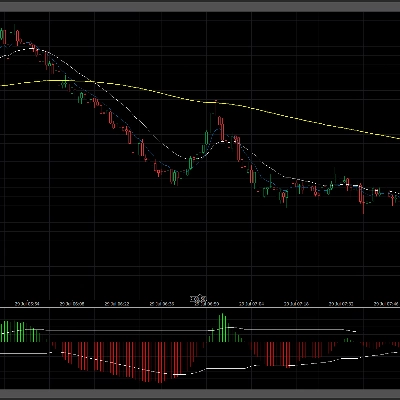
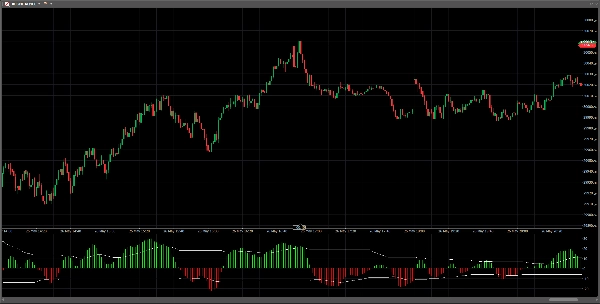
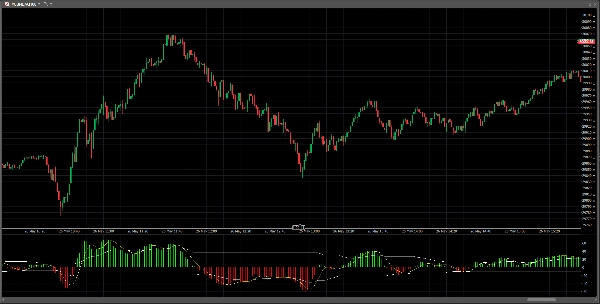
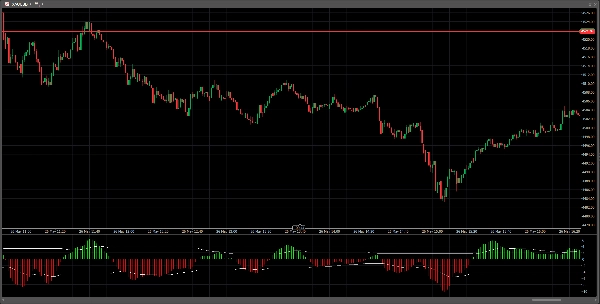
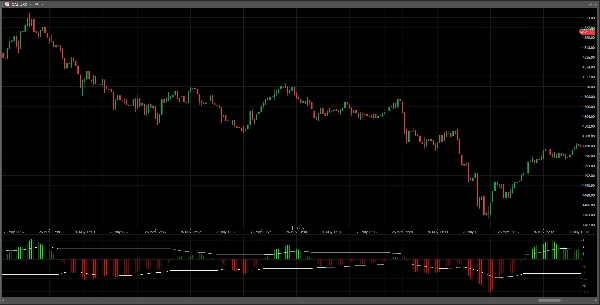
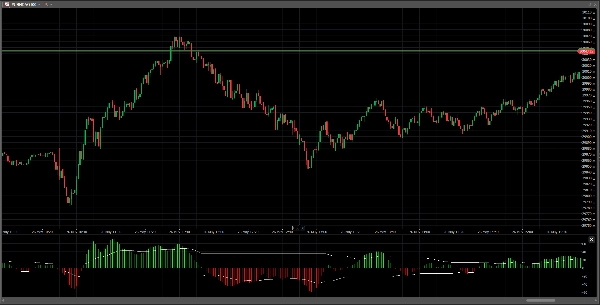
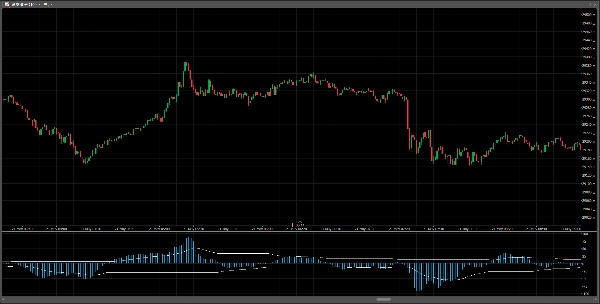
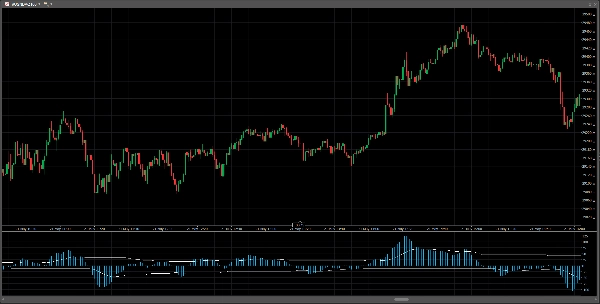
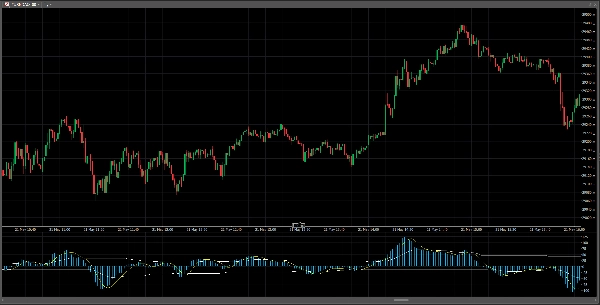
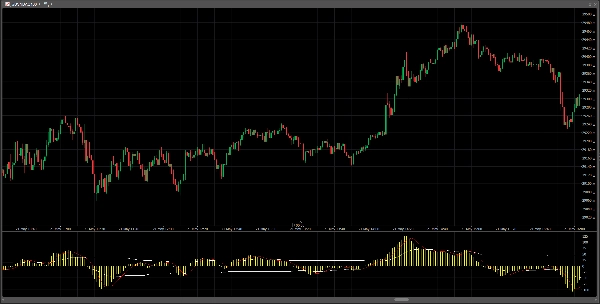
Il fonctionne comme un système de trading en lui-même. Il fournit un signal d'achat lorsque l'histogramme croise la ligne zéro vers le haut et un signal de vente lorsque l'histogramme croise la ligne zéro vers le bas.
2) INDIQUE LE MOMENTUM :
Le momentum fait référence à la force et à la vitesse avec lesquelles le prix évolue. Si le momentum augmente, cela signifie que le mouvement des prix a plus de force (plus d'acheteurs ou de vendeurs le poussant). Si le momentum diminue, le mouvement perd de la force, bien que le prix puisse continuer dans la même direction. Lorsque les barres de l'histogramme EWO franchissent la bande de rupture, vers le haut ou vers le bas, cela indique que le momentum est exceptionnellement fort et que le marché entre dans une phase impulsive très puissante.
3) VALIDATEUR DE COMPTAGE DE VAGUES :
Il permet d'identifier et de valider les vagues (impulsions et corrections) dans le système de comptage proposé par Elliott.
Réglez les couleurs selon vos goûts et préférences.
EWO (Oscillateur de Vagues d'Elliott)
L'EWO est un outil précieux pour les traders cherchant à obtenir une vision complète du marché et à prendre des décisions éclairées.
1) SYSTÈME DE TRADING :
Il fonctionne comme un système de trading en lui-même. Il fournit un signal d'achat lorsque l'histogramme croise la ligne zéro vers le haut et un signal de vente lorsque l'histogramme croise la ligne zéro vers le bas.
2) INDIQUE LE MOMENTUM :
Le momentum fait référence à la force et à la vitesse avec lesquelles le prix évolue.
Si le momentum augmente, cela signifie que le mouvement des prix a plus de force (plus d'acheteurs ou de vendeurs le poussant).
Si le momentum diminue, le mouvement perd de la force, bien que le prix puisse encore continuer dans la même direction.
Lorsque les barres de l'histogramme EWO franchissent la bande de rupture, vers le haut ou vers le bas, cela indique que le momentum est exceptionnellement fort et que le marché entre dans une phase impulsive très puissante.
3) VALIDATEUR DE COMPTAGE DE VAGUES :
Il permet d'identifier et de valider les vagues (impulsions et retracements) dans le système de comptage proposé par Elliott.
Réglez les couleurs selon vos goûts et préférences.
Résumé
Discussion
Avis clients
Questions fréquentes
Plus de cet auteur


















Prix