
Описание
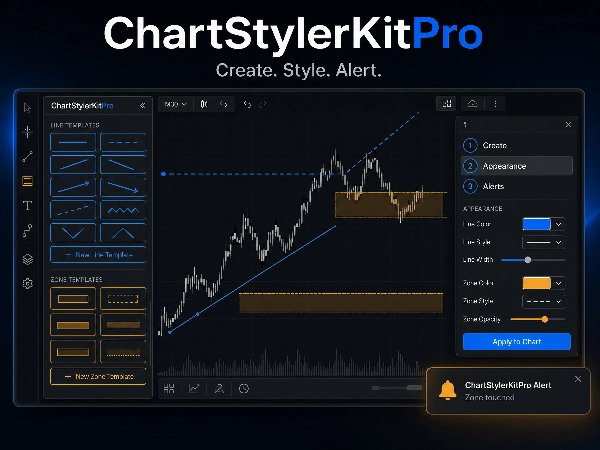
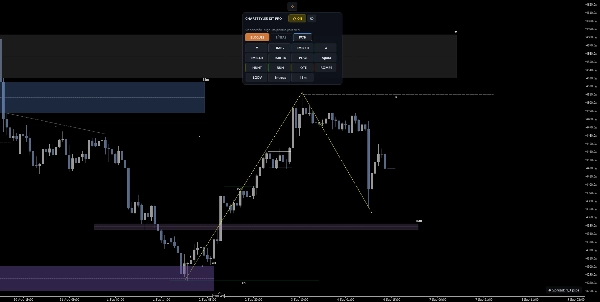
ChartStyleKitPro — это индикатор cTrader, разработанный как централизованная панель управления для управления, стилизации и организации графических объектов (прямоугольников и трендовых линий). Его цель — устранить ручную и повторяющуюся задачу индивидуальной стилизации каждого рисунка на графике, предлагая массовые действия, повторно используемые шаблоны и интеллектуальный автоматический текст.
Индикатор функционирует как наложение: он не генерирует сигналы и не рассчитывает технические индикаторы. Его ценность заключается в повышении производительности и визуальной согласованности анализа графиков.
Ключевые особенности
1. Интерактивная панель управления
Создайте именованный шаблон
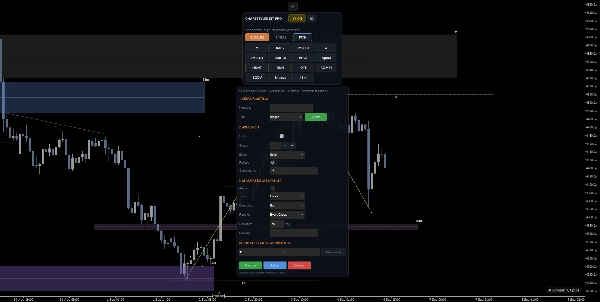
Откройте значок шестерёнки и найдите 1. CREATE TEMPLATE. В этом разделе введите начальное имя шаблона, выберите Block или Line и нажмите Create. Таким образом, шаблон получает своё имя на этом первом этапе.
Новый шаблон начинается с безопасных, редактируемых значений: базовый цвет, толщина, сплошной стиль, заливка в зависимости от типа и отключённые оповещения. Создание не рисует объект автоматически; сначала он регистрирует шаблон, чтобы его можно было просмотреть и использовать из сетки.
2. Настройка внешнего вида
Выберите визуальные свойства, которые хотите повторно использовать. Нажмите Save для сохранения изменений.
3. Автоматическая линия 50%
Для каждого нарисованного прямоугольника индикатор автоматически вычисляет и рисует горизонтальную линию в средней точке (50%) между верхней и нижней ценой прямоугольника.
- Линия по умолчанию пунктирная (настраиваемая)
- Включает метку "50%" на левом краю
- Обновляется в реальном времени при перемещении или изменении размера прямоугольника
- Скрывается/показывается вместе с родительским прямоугольником (ведёт себя как один объект)
Типичное использование: зоны равновесия внутри ценового диапазона, уровни принятия решений внутри зон спроса/предложения.
3. Automatic 50% line
For each rectangle drawn, the indicator automatically calculates and draws a horizontal line at the midpoint (50%) between the upper and lower price of the rectangle.
- The line is dotted by default (configurable)
- Includes a "50%" label on the left edge
- Updates in real time if you move or resize the rectangle
- Hides/shows together with the parent rectangle (behaving as a single object)
- Typical use: equilibrium zones within a price range, decision levels within supply/demand zones.
4. Автоматический текст в прямоугольниках
Если у прямоугольника есть Комментарий, индикатор отображает его как видимый текст внутри прямоугольника.
- Позиция рассчитывается автоматически: верхний правый угол с настраиваемыми отступами
- Вертикальный отступ в пипсах (от верхнего края)
- Горизонтальный отступ в часах (от правого края)
- Размер шрифта адаптируется к размеру окна
- Цвет, жирность и шрифт настраиваемы
- Типичное использование: метки, такие как "Зона предложения", "Зона покупки", "FVG", "Order Block", отображаемые непосредственно на зоне без необходимости дополнительного ручного текста.
5. Шаблоны стилей
Полная система CRUD (Создание, Чтение, Обновление, Удаление) для сохранения и повторного использования визуальных конфигураций объектов.
Что сохраняет каждый шаблон:
- Цвет
- Толщина
- Стиль линии (сплошной, пунктирный и т.д.)
- Заливка (для прямоугольников)
- Состояние видимости
- Состояние блокировки
- Комментарий
Доступные операции:
ДействиеОписание
Сохранить
Извлекает стиль из выбранного объекта и сохраняет его с пользовательским именем. Включает необязательное поле комментария.
Применить
Загружает сохранённый шаблон и применяет его ко всем выбранным объектам.
Обновить
Перезаписывает существующий шаблон текущим стилем выбранного объекта.
Переименовать
Изменяет имя существующего шаблона.
Удалить
Удаляет шаблон из хранилища.
Тёплые тона, меньше напряжения глаз при длительных сессиях
Акцентный цвет настраивается (по умолчанию синий #4DA6FF). Кнопки-переключатели автоматически рассчитывают активные/неактивные цвета с гарантированным хорошим контрастом.
Сводка
Key features include:
- Interactive control panel: When selecting graphical objects, a floating panel appears showing the count and type of selected items, with buttons to lock/unlock, hide/show, toggle fill for rectangles, hide/show all objects, and manage style templates. Contextual help guides available actions.
- Automatic 50% line: For each rectangle, the indicator draws a horizontal line at the midpoint between its top and bottom prices, updating in real time with movement or resizing. This line includes a "50%" label and hides/shows with its parent rectangle.
- Automatic text rendering: Comments attached to rectangles or trend lines are displayed as text within or above the objects, with configurable position, margins, font size, and style.
- Style templates: A full CRUD system allows saving, applying, updating, renaming, and deleting visual style templates that store color, thickness, line style, fill, visibility, lock state, and comments for objects.
- Four interface color themes: Dark, Light, Midnight, and Warm, each with configurable accent colors and automatic toggle button contrast.
This tool supports efficient management of chart annotations commonly used in market structure and Smart Money Concepts analysis, including supply/demand zones, order blocks, fair value gaps, and support/resistance levels.
Отзывы покупателей
Обсуждение
Частые вопросы


















Цена
