
Opis
Wskaźnik Wartości Rekurencyjnej Wewnętrznej
Przegląd
Wartość Rekurencyjna Wewnętrzna to niestandardowy wskaźnik wykorzystujący rekurencyjne obliczenia względnej siły na wielu okresach do identyfikacji wewnętrznych trendów rynkowych. Określa kluczowe poziomy cen, na których siła trendu osiąga krytyczny poziom, oferując wgląd w potencjalne odwrócenia i potwierdzenia trendów. Koncepcja Wartości Rekurencyjnej Wewnętrznej opiera się na założeniu, że momentum rynku i siła trendu mogą być rekurencyjnie udoskonalane poprzez zastosowanie wielu warstw analizy ruchu cen. To rekurencyjne podejście pomaga zidentyfikować głęboko zakorzenione warunki bycze i niedźwiedzie, które tradycyjne wskaźniki oparte na cenach mogą przeoczyć.
Strefy Handlu Byczego i Niedźwiedziego
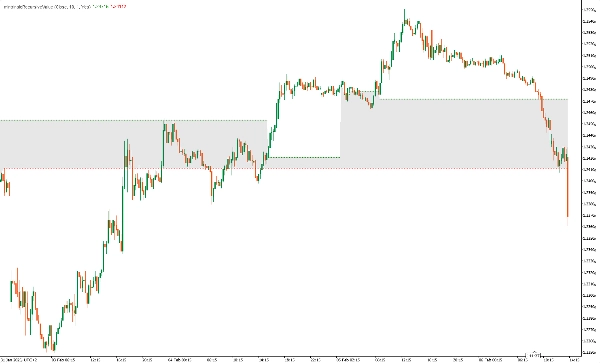
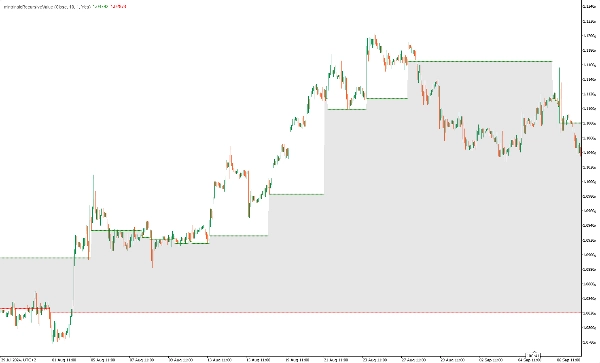
- Strefa Handlu Byczego: Ta strefa powstaje, gdy wartość rekurencyjna wewnętrzna potwierdza trwałą siłę byczą. Występuje, gdy wszystkie rekurencyjne obliczenia względnej siły wskazują na utrzymujące się wartości powyżej równowagi, sugerując silne momentum wzrostowe. Strefa handlu byczego pomaga traderom zidentyfikować potencjalne punkty wejścia na długą pozycję oraz dynamiczne obszary wsparcia, gdzie cena może nadal rosnąć.
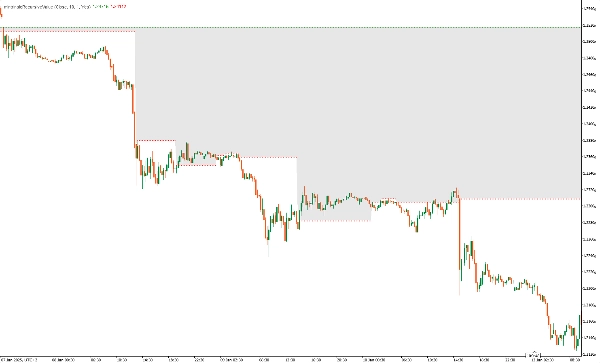
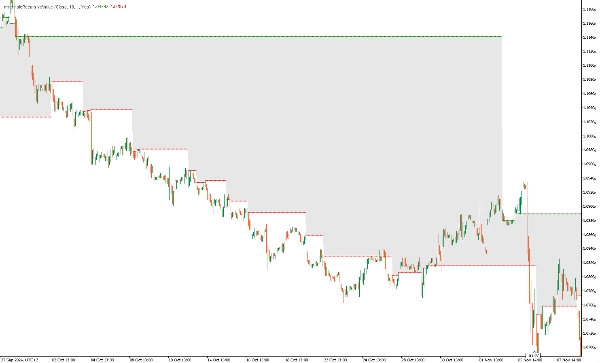
- Strefa Handlu Niedźwiedziego: Ta strefa jest ustalana, gdy wartość rekurencyjna wewnętrzna identyfikuje ciągłą siłę niedźwiedzią. Gdy wszystkie wartości rekurencyjnej względnej siły znajdują się poniżej równowagi, sygnalizuje to trwający trend spadkowy, dając traderom możliwości wejścia na krótką pozycję oraz definiując dynamiczne poziomy oporu, gdzie cena może nadal spadać.
Wyniki Wskaźnika
- outIntrinsicRecursiveLong : Wyświetla wewnętrzny poziom długi, gdy wykryta zostanie siła bycza.
- outIntrinsicRecursiveShort: Wyświetla wewnętrzny poziom krótki, gdy wykryta zostanie siła niedźwiedzia.
Zastosowanie
- Potwierdzenie Trendu: Pomaga w identyfikacji silnych trendów byczych lub niedźwiedzich, gdy wszystkie okresy względnej siły są zgodne.
- Wykrywanie Odwróceń: Sygnalizuje potencjalne punkty zwrotne, gdy wartość wewnętrzna się zmienia.
- Poziomy Wsparcia i Oporu: Wartości wewnętrzne działają jako dynamiczne poziomy wsparcia i oporu.
Przykładowa Strategia Handlowa
- Wejście Długie: Wejdź w długą pozycję, gdy ustalony zostanie wewnętrzny poziom długi, a ruch cen potwierdzi bycze momentum, co oznacza, że cena jest powyżej wartości równowagi (zielony składnik wskaźnika).
- Wejście Krótkie: Wejdź w krótką pozycję, gdy ustalony zostanie wewnętrzny poziom krótki, a ruch cen potwierdzi niedźwiedzie momentum, co oznacza, że cena jest poniżej wartości równowagi (czerwony składnik wskaźnika).
- Strategia Wyjścia: Używaj trailing stopów lub zaniku poziomów wewnętrznych do wychodzenia z pozycji
Uwagi
- Wskaźnik jest zaprojektowany do strategii podążających za trendem i najlepiej działa na rynkach trendujących.
- Może być łączony z innymi wskaźnikami, takimi jak wskaźniki momentum, dla potwierdzenia sygnałów handlowych.
Podsumowanie
Wskaźnik Wartości Rekurencyjnej Wewnętrznej to potężne narzędzie dla traderów chcących ulepszyć analizę trendów za pomocą rekurencyjnych obliczeń względnej siły. Poprzez identyfikację kluczowych poziomów cen z wysokim prawdopodobieństwem trendów, wskaźnik ten dostarcza cennych informacji o kierunku rynku i potencjalnych okazjach handlowych.
Podsumowanie
The indicator defines Bullish and Bearish Trade Zones: the Bullish Trade Zone signals sustained upward momentum when all recursive strength values exceed equilibrium, suggesting potential long entry points and dynamic support levels. Conversely, the Bearish Trade Zone indicates ongoing downtrends when values fall below equilibrium, identifying short entry opportunities and dynamic resistance levels.
Outputs include intrinsic long and short levels that display when bullish or bearish strength is detected. Use cases encompass trend confirmation, reversal detection, and identification of dynamic support and resistance levels. An example strategy involves entering long trades when intrinsic long levels align with bullish price action and short trades when intrinsic short levels coincide with bearish momentum, with exits managed via trailing stops or disappearance of intrinsic levels.
Designed primarily for trend-following strategies in trending markets, this indicator can be combined with other momentum tools for trade confirmation.


