
E7 Volume Profile
Индикатор
1.15K скачивания
Версия 1.0, Feb 2025
Windows, Mac
4.6
Отзывы: 3
Описание
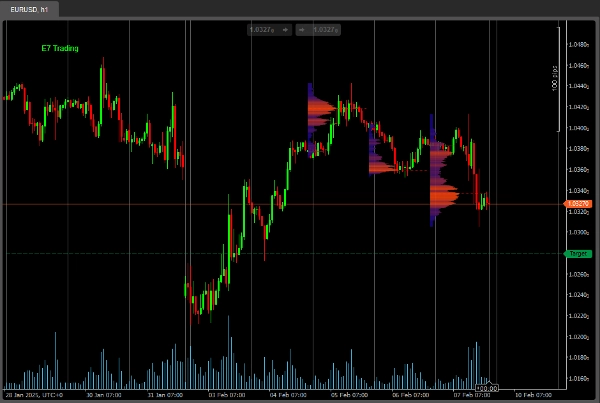
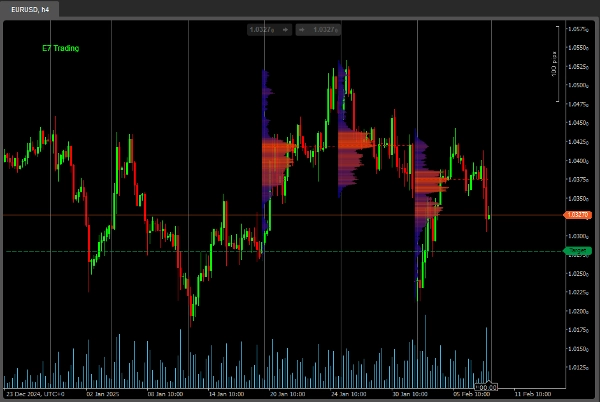
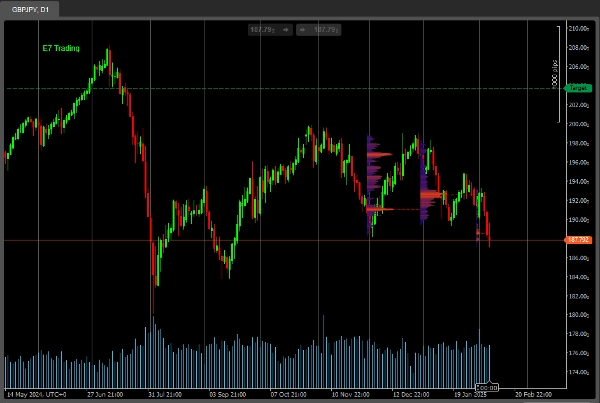
Это простой индикатор объемного профиля, адаптированный для более современного внешнего вида и ощущения.
Эта базовая версия ограничена всего 3 'Периодами обратного просмотра'.
Полная версия скоро появится, следите за обновлениями.
Удачной охоты!
Сводка
ИИ-сводка
E7 Volume Profile is a volume profile indicator designed with a modern visual style. It provides traders with volume distribution information over price levels, helping to identify key support and resistance areas. This basic version supports analysis over three distinct lookback periods, allowing users to observe volume patterns within limited historical ranges. The indicator is suitable for use on various timeframes, as illustrated by examples on 1-hour, 4-hour, and daily charts. A full version with expanded features is planned for future release.
Профиль индикатора
Отзывы покупателей
4.6
Отзывы: 3
5 | 67 % | |
4 | 33 % | |
3 | 0 % | |
2 | 0 % | |
1 | 0 % |
Отзывы покупателей
July 14, 2025
Pros: Clearly visualizes volume distribution with POC, VAH, VAL zones. Customizable and stable across timeframes. Cons: No tooltips or alerts. Lacks template saving and dynamic profile history. Requires confirmation tools for trading signals.
Обсуждение
Частые вопросы
Продукты, доступные в cTrader Store, включая торговых ботов, индикаторы и плагины, предоставляются сторонними разработчиками и доступны исключительно в информационных и технических целях. cTrader Store не является брокером и не предоставляет инвестиционные консультации, персональные рекомендации или какие-либо гарантии будущей доходности.
Больше от этого автора


Цена
С 18/12/2024
2
Продажи
4.25K
Бесплатные установки