present
Daftar dan dapatkan diskon $50 untuk pembelian pertama Anda
Trading product for Fixed Range Volume Profile - Manual Indikator Key Levels Volume, image 1
Fixed Range Volume Profile - Manual
Indikator
Versi 1.0, Oct 2026
Windows, Mac
Trading product for Fixed Range Volume Profile - Manual Indikator Key Levels Volume, image 2
Trading product for Fixed Range Volume Profile - Manual Indikator Key Levels Volume, image 3
Trading product for Fixed Range Volume Profile - Manual Indikator Key Levels Volume, image 4
Sejak 16/09/2026

Deskripsi

Fixed Range Volume Profile - Manual is a cTrader chart indicator that groups tick observations by price within a selected time range. The Full version displays the profile together with the Point of Control (POC), Value Area High (VAH) and Value Area Low (VAL).


Select a range


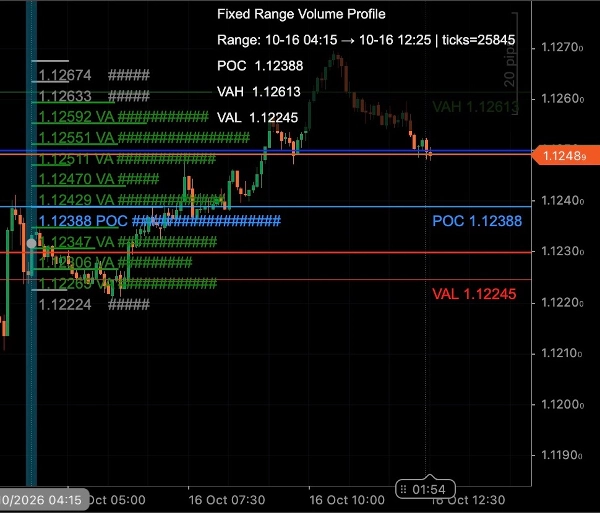
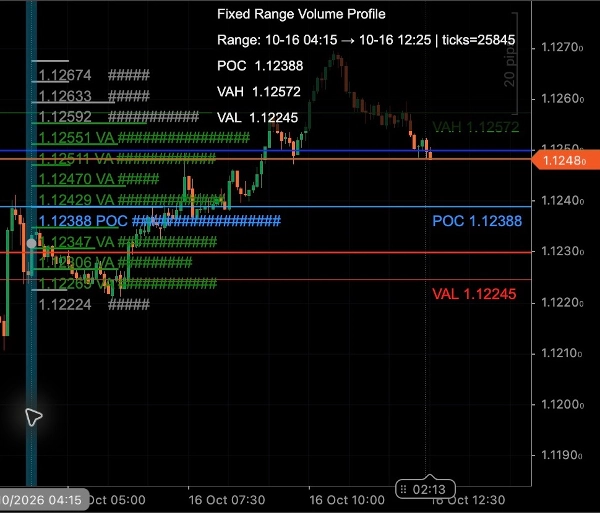
Add the Full indicator to a chart, then move its start and end vertical lines to select the period you want to examine. The profile and its levels recalculate for that range. The chart panel shows the selected range, the number of included tick observations, and the POC, VAH and VAL prices.


Configure the profile


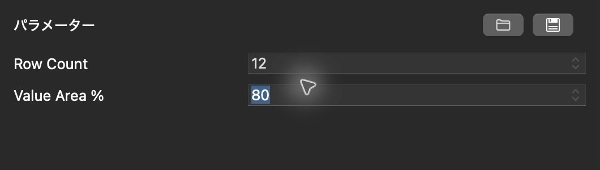
- Row Count: 12–100 price rows; default 32.

- Value Area %: 50–95%; default 70%.


POC marks the price row with the greatest number of tick observations. The value area expands from the POC across neighbouring rows to include the configured share of those observations. VAH and VAL mark its upper and lower boundaries.


Understand the data


Each available tick contributes one observation at the midpoint of its Bid and Ask prices. This is a profile of tick activity, not exchange-traded volume, buy/sell volume or order-flow delta.


The indicator examines up to the latest 100,000 available ticks and includes those within the selected time range. Results therefore depend on the broker's tick history and the data loaded in cTrader. Selecting a range does not guarantee that complete tick history is available for that period.


Get started


1. Install the purchased indicator in cTrader Desktop using the same cTrader ID used for the purchase. Open Algo > Indicators, select Fixed Range Volume Profile - Manual and add an instance for your symbol and timeframe. You can also attach it through the chart indicator selector.

2. In the instance Parameters panel, set Row Count and Value Area %, or retain their defaults. Row Count changes the price-bin resolution; Value Area % changes the share of tick observations used for the value area.

3. Select and drag the indicator's start and end vertical lines to choose the time range. Check the Range dates shown in the upper-right panel after moving a boundary.

4. Read the profile, POC, VAH and VAL alongside the selected range and tick count in the chart panel.


The indicator is an analysis tool. It does not place or manage trades and does not predict price reactions at the displayed levels.


Reading the screenshots


The 70% value-area chart shows the selected range and horizontal tick-activity profile at 70% value area. The 80% value-area chart shows POC, VAH and VAL with an 80% value area. Blue marks POC, green marks value-area rows and VAH, and red marks VAL. Grey rows are outside the value area. The settings image shows the actual Row Count and Value Area % controls, set to 12 and 80 for the 80% example. These are example settings, not the defaults. The chart also contains normal price candles and a current-price marker; the indicator does not generate trade signals.


Limitations


Tick activity describes quote updates supplied by the broker, not the quantity of contracts or shares traded. Different brokers and available history can produce different profiles. Older or unavailable history may leave the selected range incomplete. The displayed levels describe the selected observations and are not guaranteed support, resistance or future prices. No separate Store trial is provided.


Ringkasan

AI summary
Fixed Range Volume Profile - Manual is a cTrader chart indicator that visualizes tick activity grouped by price within a user-selected time range. It displays a volume profile highlighting the Point of Control (POC)—the price level with the highest tick count—along with the Value Area High (VAH) and Value Area Low (VAL), which define the upper and lower boundaries of the value area containing a configurable percentage of tick observations.

Users add the indicator to a chart and adjust start and end vertical lines to select the analysis period. The profile recalculates dynamically for the chosen range, showing the number of tick observations and key levels in the chart panel. Configuration options include setting the number of price rows (12 to 100) and the value area percentage (50% to 95%), affecting the profile’s resolution and value area size.

The indicator uses tick data representing quote updates at the midpoint between bid and ask prices, not actual traded volume or order flow. It processes up to 100,000 recent ticks depending on broker data availability. This tool provides visual insight into price-level activity but does not generate trade signals or manage orders.

Profil indikator
Kategori indikator
Volume
Tipe output
Visualisasi
Persyaratan data
Data tick

Ulasan pelanggan

0.0
Ulasan: 0
Ulasan pelanggan
Belum ada ulasan untuk produk ini. Sudah mencobanya? Jadilah pemberi ulasan pertama!

Diskusi

Pertanyaan umum

Key Levels
Volume
Produk-produk yang tersedia melalui cTrader Store, termasuk bot trading, indikator, dan plugin, disediakan oleh pengembang pihak ketiga serta hanya ditujukan untuk akses teknis dan informasi. cTrader Store bukan broker dan tidak menyediakan saran investasi, rekomendasi pribadi, atau jaminan apa pun tentang kinerja di masa mendatang.

Produk lain dari penulis ini

Indikator
BOS
MSS
+4
See confirmed BOS, CHOCH and SWEEP structure events on your cTrader chart.
Indikator
BOS
Add standard-timeframe context candles to a native Renko chart.
Indikator
EMA
Volume
Map range high, mid, low, price location and a deterministic pressure proxy on your cTrader chart.
Indikator
Channel
Key Levels
+1
Monitor a selected chart trendline and confirm breaks on candle close.
Plugin desktop
Trade Journal
Trade Statistics
See not only what you made or lost, but which trading behaviours caused the damage.
Plugin desktop
Chart UI Tools
Keep lines, zones and channels synced across selected same-symbol charts from one desktop plugin.
cBot
Drawdown Guard
Daily Loss Limit
Monitor account-wide loss and stop-loss risk budgets, with optional order cancellation and post-fill closure.
Plugin desktop
Position Sizer
Risk Calculator
Size manual trades from your risk settings and review Market, Limit or Stop orders before execution.

Anda mungkin juga suka

Indikator
Prop
Forex
+13
Identifies market compression zones and explosive Breakout moments using mathematical modeling.
Indikator
ATR
RSI
+5
Delta RSI Candle Pro, the indicator that transforms ordinary candlesticks into powerful momentum visualizers.
Indikator
The Multi-Timeframe Candle Indicator displays candles from multiple timeframes in one window, enhancing market analysis!
Indikator
Doji
Wedge
+5
Angora Pattern Recognition is a cTrader indicator that finds, draws and tracks classic chart patterns automatically.
Indikator
Forex
BTCUSD
+11
Unlock trading precision with QQE! Dual QQE indicators with a Bollinger Bands zero line provide clear buy/sell signals.
Indikator
Forex
Crypto
+3
Detect powerful 2-candle reversal patterns at key highs/lows. Boost entries with real-time alerts and visual signals.
Indikator
Spot Strong Trends Early & Filter Market Noise
Indikator
Supertrend
Moving Average
Easy Trade: Trend & Breakout Indicator for cTrader
Indikator
ATR
SMC
+5
Candles Volume Delta is a powerful, visually intuitive indicator that transforms raw tick volume into actionable trading
Indikator
Forex
BTCUSD
+5
This indicator displays the OrderBlocks of the current and higher timeframe, made by ICT's student.
Indikator
AI
SMC
+5
Complete ICT Killzones: 5 sessions, easy colors, transparency controls & session info. Professional timing for cTrader.
Indikator
Pin Bar
Inside Bar
+2
Advanced candlestick pattern recognition with structural quality scoring, alerts and adaptive chart visuals.
Indikator
BOS
Add standard-timeframe context candles to a native Renko chart.
Indikator
VWAP
Forex
+12
Unlock VWAP in cTrader! Choose anchor periods, price sources, and display deviation bands with real-time tick updates.
Indikator
AI
SMC
+13
Dynamic Liquidity Depth exposes hidden volume
Indikator
AI
ATR
+27
Supertrend Indicator
Indikator
Volume
Custom range volume profile between two draggable anchors. Auto source timeframe, Total/Up-Down/Delta, POC, Value Area.
Indikator
Forex
Version 3: Full control of session display including start and end times of all 3 sessions!

Harga

Sejak 16/09/2026