VIX - volatility indicator - Renko
อินดิเคเตอร์
เวอร์ชัน 1.0, Feb 2025
Windows, Mac
คำอธิบาย
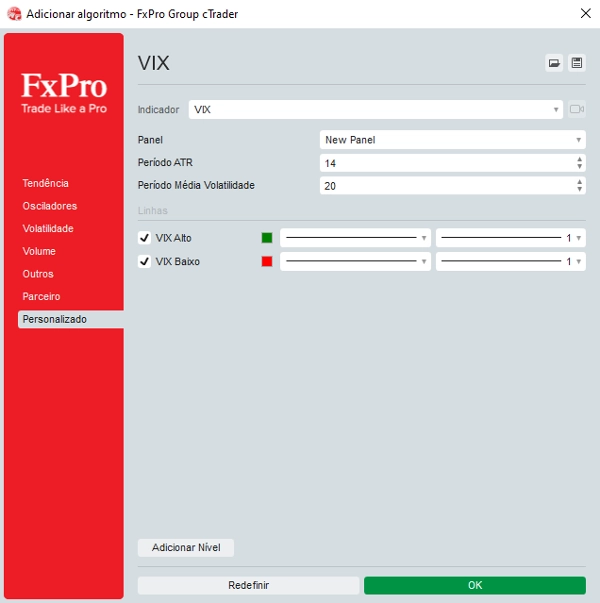
ปรับพารามิเตอร์: ป้อนค่าที่ต้องการสำหรับระดับ LowLevel และ HighLevel และปรับ VIX Scale Factor เพื่อให้เส้น VIX มีความสูงตามที่ต้องการ
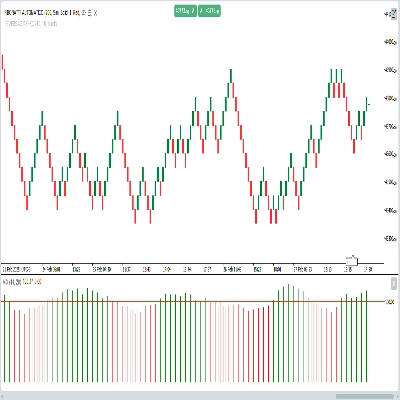
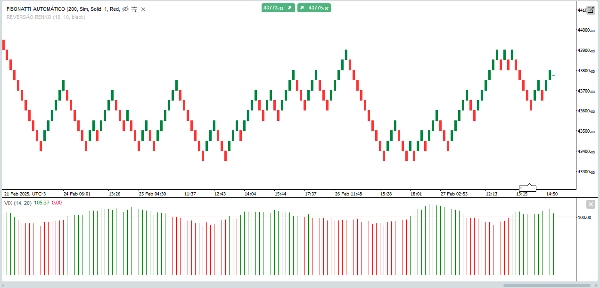
ดูที่กราฟ:
เมื่อ VIX สูงกว่า HighLevel และปริมาณสูง (แท่งเทียนสีเขียว) คุณสามารถพิจารณาว่าเกิดการเบรกเอาต์
เมื่อ VIX ต่ำกว่า LowLevel อาจบ่งชี้ถึงช่วงเวลาของความผันผวนต่ำ
สรุป
โปรไฟล์อินดิเคเตอร์
รีวิวจากลูกค้า
0.0
รีวิว: 0
รีวิวจากลูกค้า
ยังไม่มีรีวิวสำหรับผลิตภัณฑ์นี้ หากเคยลองแล้ว ขอเชิญมาเป็นคนแรกที่บอกคนอื่น!
การสนทนา
คำถามที่พบบ่อย
Breakout
ผลิตภัณฑ์ที่มีให้บริการผ่าน cTrader Store รวมถึงบอทการเทรด อินดิเคเตอร์ และปลั๊กอิน มีให้บริการโดยนักพัฒนาบุคคลที่สามและมีไว้เพื่อวัตถุประสงค์ในการเข้าถึงข้อมูลและทางเทคนิคเท่านั้น cTrader Store ไม่ใช่โบรกเกอร์และไม่ได้ให้คำแนะนำการลงทุน คำแนะนำส่วนบุคคล หรือการรับประกันผลการดำเนินงานในอนาคต


!["[Stellar Strategies] Market Session Ultimate" โลโก้](https://cdn.ctrader.com/image/webp/61ffd537-0125-4246-9e72-42eca1791d64_28232)


ราคา
ตั้งแต่ 05/02/2025
30
การขาย