
설명
📈 스토캐스틱 RSI
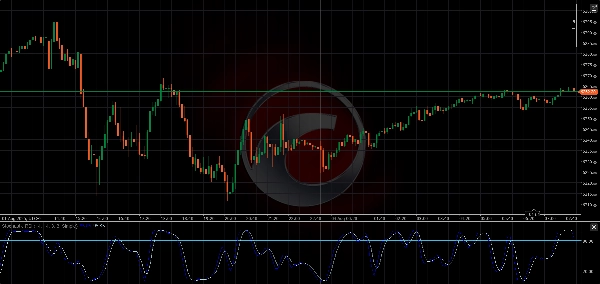
스토캐스틱 RSI 지표는 가격이 아닌 RSI 값에 스토캐스틱 공식을 적용한 모멘텀 오실레이터로, 2차 미분 지표입니다. 표준 RSI보다 더 높은 민감도로 과매수 및 과매도 상태를 식별하는 데 특히 유용합니다.
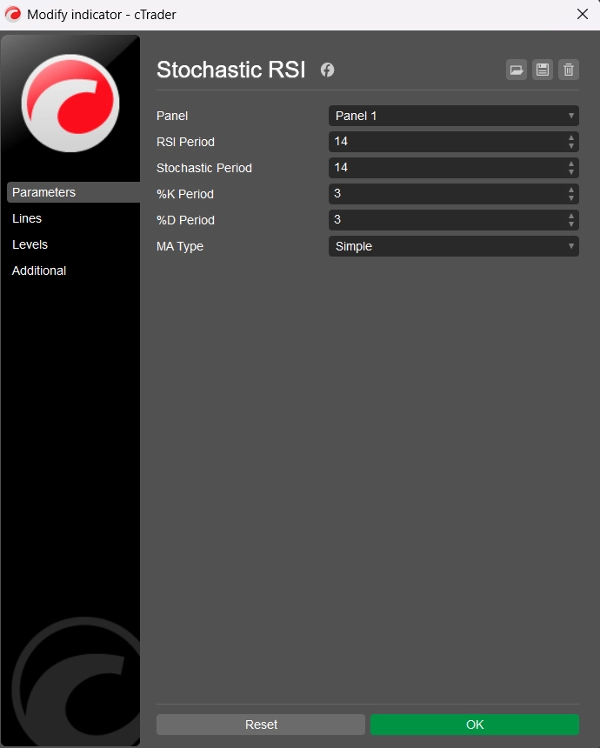
🛠️ 매개변수
RSI 기간: 기본 RSI를 계산하는 데 사용되는 조회 기간 (기본값 = 14)
스토캐스틱 기간: 스토캐스틱 RSI를 계산하기 위해 RSI 값에 적용되는 조회 기간 (기본값 = 14)
%K 기간: %K 선의 평활 기간 (기본값 = 3)
%D 기간: %D 선의 평활 기간 (기본값 = 3)
MA 유형: 평활을 위한 이동 평균 유형: 단순 또는 지수 (기본값 = 단순)
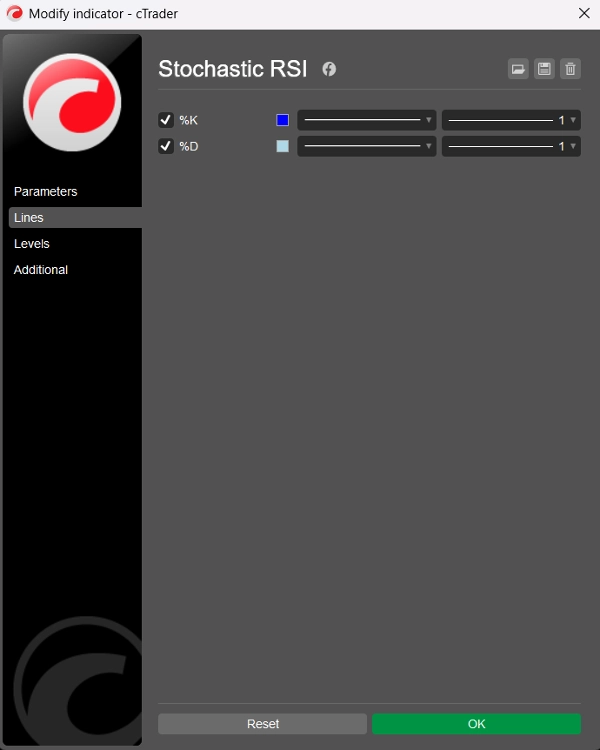
📊 출력 선
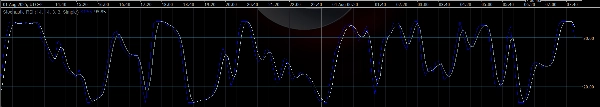
- %K 선: 평활된 스토캐스틱 RSI (파란색)
- %D 선: %K의 평활 이동 평균 (연한 파란색)
두 선 모두 0과 100 사이에서 진동하여 명확한 과매수 및 과매도 신호를 제공합니다.
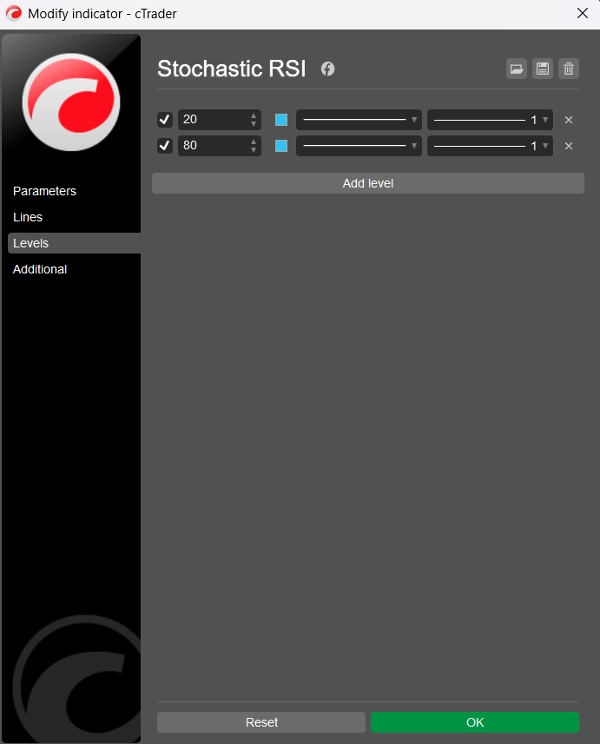
⚠️ 권장 수준
기본적으로 지표는 정적 수준을 표시하지 않지만, 사용자는 cTrader의 “Levels” 탭을 통해 수동으로 추가하는 것이 권장됩니다:
- 레벨 80 → 과매수
- 레벨 20 → 과매도
이 수준들은 전통적인 스토캐스틱 오실레이터와 유사하게 작동하지만 RSI 동작에 적용되어 신호가 더 명확하고 종종 더 빠릅니다.
🧠 사용 방법
- 과매수 (>80): 가격이 과도하게 상승했음을 나타낼 수 있으며, 반전 또는 조정 가능성이 있습니다.
- 과매도 (<20): 가격이 과매도 상태임을 신호할 수 있으며, 반등 또는 추세 반전 가능성이 있습니다.
- %K와 %D 교차: 스토캐스틱 또는 MACD와 유사하게 사용할 수 있으며, 20 아래에서의 강세 교차 또는 80 위에서의 약세 교차가 실행 신호가 될 수 있습니다.
🏷️ 참고 사항
- C# 및 Automate API를 사용하여 cTrader용으로 제작됨
- 두 가지 MA 유형으로 깔끔하고 효율적이며 사용자 정의 가능
- 코드 및 로직: BlueRocketBots & ChatGPT (OpenAI)
- 깔끔한 코드 (총 109줄; 코드 60줄, 텍스트 29줄, 빈 줄 20줄)
- 무료 제공!
요약
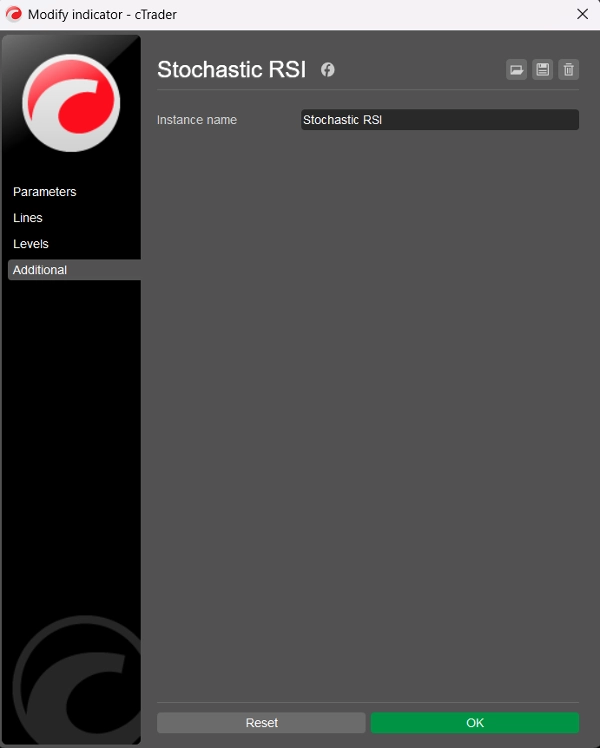
지표 프로필
고객 리뷰
0.0
리뷰: 0
고객 리뷰
이 상품에 대한 리뷰가 아직 없습니다. 이미 사용해 보셨나요? 다른 사람들에게 가장 먼저 소개해 주세요!
상담
자주 묻는 질문(FAQ)
트레이딩 봇, 지표, 플러그인 등 cTrader Store에서 제공되는 상품은 제3자 개발자에 의해 제공되며, 이는 단순히 정보 및 기술적 접근을 목적으로 제공된 것입니다. cTrader Store는 중개인이 아니며, 투자 조언, 개인별 추천 또는 향후 성과에 대한 어떠한 보장도 제공하지 않습니다.
이 작성자의 상품 더 보기

좋아하실 만한 다른 항목


가격
가입일 24/05/2025
222
무료 설치