Açıklama
Çubuk Bilgi Paneli: Herhangi bir çubuk için anında, yapılandırılabilir hover-bilgi
Genel Bakış
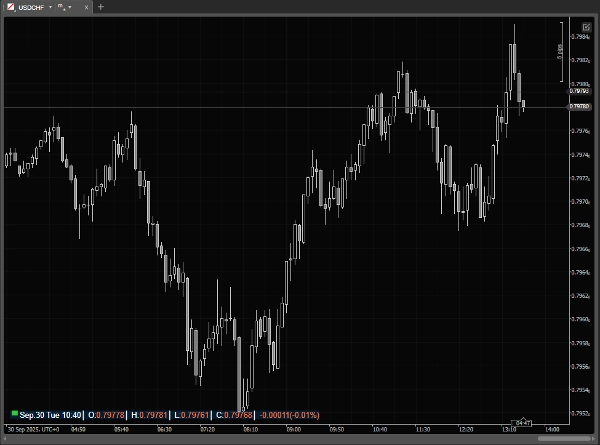
Çubuk Bilgi Paneli, grafikteki herhangi bir çubuk hakkında size anında, kesin bilgi veren hafif bir cTrader üst katmanıdır. Fare grafik dışında olduğunda, mevcut piyasa oturumu ve sunucu/yerel/UTC zamanı ile kompakt bir durum satırı gösterir.
cTrader zaten çubuk bilgisi sağlar, ancak sadece ana pencere durum çubuğunda - yani ayrılmış grafikler kullanıldığında görünmez. Ayrıca özelleştirilemez ve küçük yazı tipi genellikle hızlı okumayı zorlaştırır. Çubuk Bilgi Paneli bu sorunları, net ve tamamen özelleştirilebilir bir üst katmanı doğrudan grafiğe getirerek çözer.
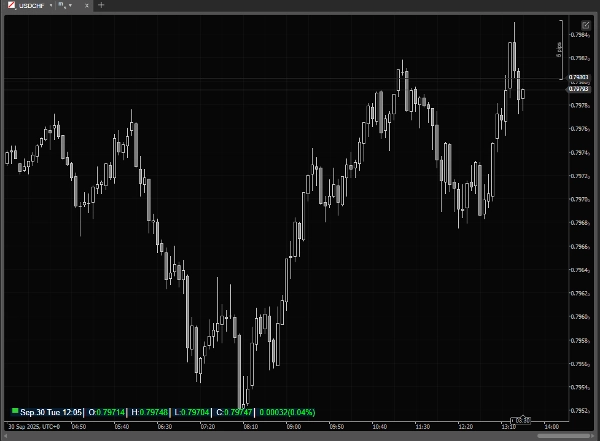
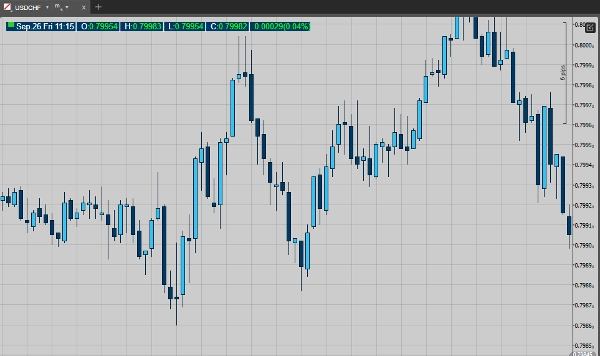
Fareyi çubukların üzerine getirin ve panel, üzerine gelinen çubuğun Tarih, Saat, Açılış, Yüksek, Düşük, Kapanış, Tick Hacmi ve (isteğe bağlı olarak) önceki çubuğa göre Yüzde Değişimini gösterir. Tüm görsel ve düzen öğeleri yapılandırılabilir, böylece panel iş akışınıza ve grafik temanıza uyum sağlar.
Ana özellikler
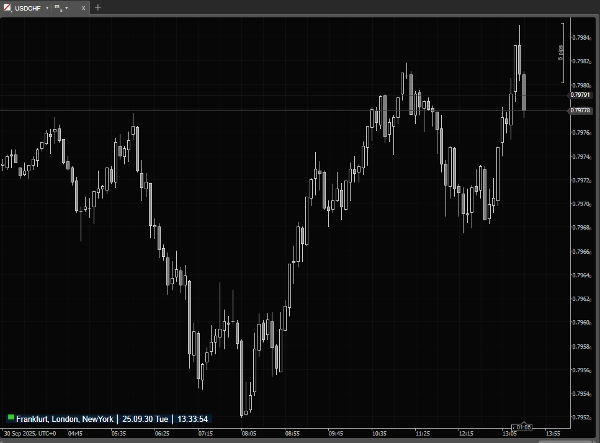
· Piyasa oturumu göstergesi + canlı zaman damgası (Yerel / Sunucu / UTC).
· Üzerine gelinen çubuğun: Tarih, Saat, A/Y/D/K, Tick Hacmi gösteren hover paneli.
· İsteğe bağlı yüzde değişim gösterimi (şimdiki ve önceki çubuk karşılaştırması).
· İki görüntüleme modu: kompakt (fare dışındayken) ve detaylı (fare grafik üzerindeyken).
· Dokuz yerleşim seçeneği + dikey ve yatay kaydırmalar için piksel boşlukları.
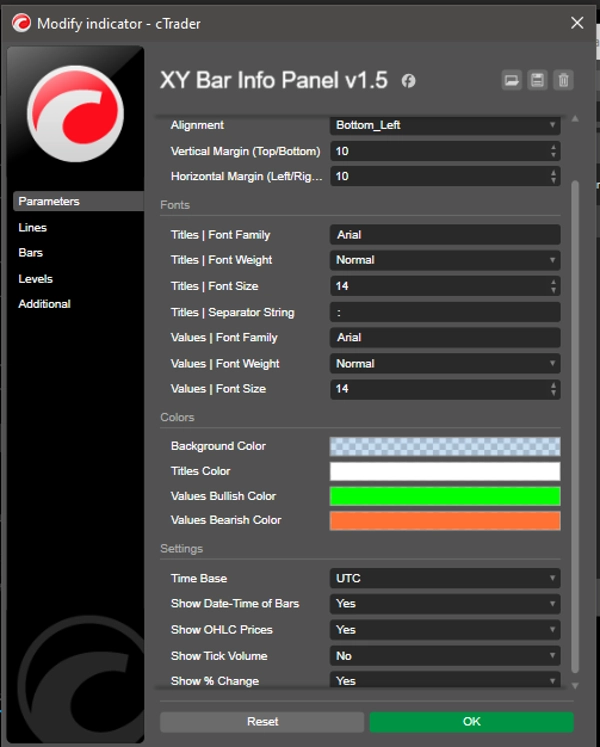
· Başlıklar (etiketler) ve değerler için ayrı yazı tipi kontrolleri (aile, kalınlık, boyut).
· Kompakt etiketleme için başlık ayırıcı dizisi.
· Özelleştirilebilir renkler: panel arka planı, başlık rengi, yükseliş (yukarı) ve düşüş (aşağı) değer renkleri.
Kullanım alanları
· Manuel işaretçi olmadan herhangi bir geçmiş veya canlı çubuğun tam OHLC ve zaman damgasını hızlıca okuyun.
· Fiyat hareketini tararken tick hacmi ve yüzde değişimi kontrol edin.
· Piyasa oturumu durumu ve sunucu/yerel/UTC zamanını hızlıca izleyin.
· Tutarlı, okunabilir çubuk verileriyle grafik ekran görüntüleri veya eğitim materyalleri hazırlayın.
· ...
Tüccarların neden seveceği
Ana pencerenin altında sabitlenen, ayrılmış grafiklerde kaybolan ve küçük, yapılandırılamayan yazı tipleri kullanan yerleşik cTrader durum çubuğunun aksine, Çubuk Bilgi Paneli istediğiniz yerde her zaman görünür, net yazı tipleri, renkler ve düzen ile. Durum çubuğunu veya işaretçi değerlerini manuel okumaya kıyasla zaman kazandırır, grafiğinizi temiz tutar ve ihtiyacınız olan bilgiyi anında sağlar. Hafif ve duyarlı yapısıyla, platformunuzu yavaşlatmadan günlük kullanım için tasarlanmıştır.
Özet
Müşteri değerlendirmeleri
5 | 100 % | |
4 | 0 % | |
3 | 0 % | |
2 | 0 % | |
1 | 0 % |