
Squeeze Momentum Indicator 2.0version
Индикатор
54 скачивания
Версия 1.0, Nov 2025
Windows, Mac
Описание
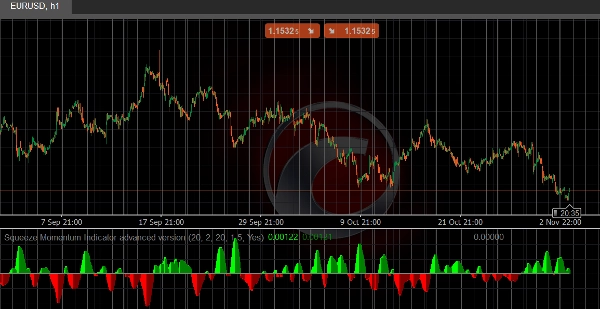
Этот индикатор cTrader реализует популярную стратегию Squeeze Momentum, предназначенную для выявления периодов консолидации с низкой волатильностью и потенциальных возможностей прорыва.
Как это работает:
- Сравнивает полосы Боллинджера с каналами Кельтнера для обнаружения условий «сжатия» волатильности
- Измеряет силу момента с помощью расчетов линейной регрессии
- Обеспечивает четкие визуальные сигналы через цветные гистограммы и динамические нулевые линии
Основные характеристики:
🎯 Обнаружение сжатия - Определяет, когда полосы Боллинджера входят внутрь каналов Кельтнера (сжатие) и когда они расширяются (прорыв)
📊 Измерение момента - Гистограмма отображает текущую силу и направление момента
🎨 Визуальные сигналы:
- Лаймовые/зеленые бары: Бычий момент (усиление/ослабление)
- Красные/бордовые бары: Медвежий момент (усиление/ослабление)
- Синяя/черная/серая нулевая линия: Нет сжатия/Активное сжатие/Освобождение сжатия
Настраиваемые параметры:
- Длина и множитель BB
- Длина и множитель KC
- Опция TrueRange для расчета канала Кельтнера
Идеально подходит для:
- Выявления прорывов консолидации
- Тайминга входов в периоды низкой волатильности
- Подтверждения направления момента
- Свинг-трейдинга и позиционной торговли
Сводка
Профиль индикатора
Отзывы покупателей
0.0
Отзывы: 0
Отзывы покупателей
У этого продукта еще нет отзывов. Уже попробовали его? Поделитесь впечатлениями!
Обсуждение
Частые вопросы
Prop
Forex
Breakout
Indices
Commodities
Crypto
Stocks
Bollinger
Продукты, доступные в cTrader Store, включая торговых ботов, индикаторы и плагины, предоставляются сторонними разработчиками и доступны исключительно в информационных и технических целях. cTrader Store не является брокером и не предоставляет инвестиционные консультации, персональные рекомендации или какие-либо гарантии будущей доходности.


Цена
10M
Торгуемый объем
10.64K
Выигранные пипы
23
Продажи
1.23K
Бесплатные установки