
Penerangan
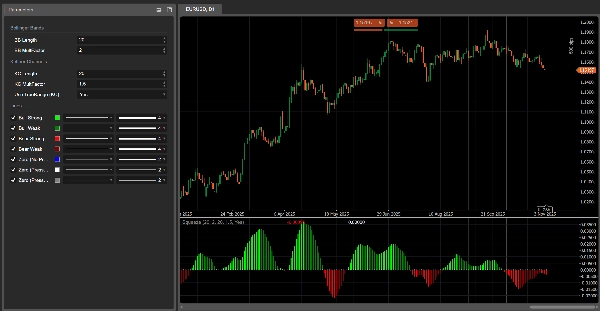
Pengimbas Tekanan 🔍📊
1. Apa yang dilakukan Pengimbas Tekanan
Pengimbas Tekanan adalah alat volatiliti-dan-arah yang:
- mengesan apabila pasaran berada di bawah tekanan / mampatan volatiliti ✅
- menunjukkan apabila tekanan itu dilepaskan ke dalam pengembangan 💥
- mengukur arah dan kekuatan pemanduan harga yang terhasil melalui nilai pengimbas yang diplotkan sebagai histogram.
Ia menggabungkan:
- sebuah jalur harga gaya Bollinger,
- sebuah saluran volatiliti gaya Keltner,
- dan sebuah garis pengimbas berasaskan regresi linear,
untuk memaparkan kedua-dua keadaan tekanan (aktif / dilepaskan / neutral) dan impuls arah (naik atau turun).
2. Cara ia berfungsi (logik)
- Sumber
Penunjuk menggunakan harga penutupan sebagai input utama. - Jalur volatiliti luar (gaya BB)
-
- Asas = SMA(tutup,
BB Length) - Penyimpangan =
KC MultFactor× sisihan piawai tutup - Jalur atas = asas + penyimpangan
- Jalur bawah = asas − penyimpangan
- Asas = SMA(tutup,
- Saluran volatiliti dalam (gaya KC)
-
- Pusat = SMA(tutup,
KC Length) - Julat = sama ada Julat Sebenar atau Tinggi−Rendah (ditetapkan oleh
Use TrueRange) - Purata julat = SMA(julat,
KC Length) - Saluran atas = pusat + purataJulat ×
KC MultFactor - Saluran bawah = pusat − purataJulat ×
KC MultFactor
- Pusat = SMA(tutup,
- Keadaan tekanan
Dengan membandingkan jalur luar dan saluran dalam: -
- Tekanan AKTIF – titik hitam pada sifar
-
- Jalur bawah > saluran bawah dan jalur atas < saluran atas
- Jalur sepenuhnya di dalam saluran → volatiliti dimampatkan, tekanan tinggi.
- Tekanan DILEPASKAN – titik kelabu pada sifar
-
- Jalur bawah < saluran bawah dan jalur atas > saluran atas
- Jalur sepenuhnya di luar saluran → volatiliti mengembang selepas tekanan.
- Tekanan neutral – titik biru pada sifar
-
- Konfigurasi lain.
- Nilai pengimbas (
val)
Histogram menunjukkan nilai pengimbas yang dikira melalui regresi linear: -
- Dalam
KC Lengthbar terakhir, penunjuk mencari: -
- tertinggi tinggi,
- terendah rendah,
- SMA tutup.
- Ia membina garis tengah dinamik:
-
- rangeMid = (tertinggi + terendah) / 2
- combinedMid = purata(rangeMid, SMA(tutup))
- Kemudian ia mentakrifkan:
scannerInput=close−combinedMid\text{scannerInput} = \text{close} - \text{combinedMid}scannerInput=close−combinedMid - Regresi linear ke atas
KC Lengthbar dijalankan ke atasscannerInputini, dan nilai akhir pada bar terakhir adalah nilai pengimbasval.
- Dalam
Tafsiran:
val > 0→ harga menekan di atas garis tengah → tekanan menaikval < 0→ harga menekan di bawah garis tengah → tekanan menurun- perubahan dalam
valdari bar ke bar → peningkatan atau penurunan dalam tekanan arah itu.
3. Cara membaca warna
Histogram – tekanan arah (nilai pengimbas)
Setiap bar histogram sepadan dengan val dan diwarnakan seperti:
- Lime –
val > 0dan meningkat (val > val sebelumnya)
→ tekanan menaik yang kuat, nilai pengimbas menguat ke atas. - Hijau –
val > 0tetapi menurun (val ≤ val sebelumnya)
→ masih menaik, tetapi tekanan semakin lemah. - Merah –
val < 0dan semakin menurun (val < val sebelumnya)
→ tekanan menurun yang kuat, pemanduan ke bawah semakin kuat. - Maroon –
val < 0tetapi meningkat (val ≥ val sebelumnya)
→ masih menurun, tetapi tekanan semakin lemah.
Jadi:
- Di atas 0 → rejim tekanan menaik
- Di bawah 0 → rejim tekanan menurun
- Perubahan warna di sisi yang sama dengan 0 = tekanan mempercepat vs melambat.
Garis sifar – keadaan tekanan
Titik yang diplot pada sifar menunjukkan keadaan tekanan:
- Biru – tekanan neutral (volatiliti normal)
- Hitam – Tekanan AKTIF (mampatan aktif)
- Kelabu – Tekanan DILEPASKAN (pengembangan selepas mampatan)
4. Rujukan parameter (Bahasa Inggeris)
BB Length
Tempoh untuk SMA dan sisihan piawai yang digunakan dalam jalur volatiliti luar.
- Lebih pendek → jalur lebih reaktif, perubahan tekanan lebih kerap.
- Lebih panjang → jalur lebih lancar, isyarat lebih sedikit tetapi lebih “makro”.
BB MultFactor
Pengganda untuk penyimpangan jalur luar (dikekalkan sebagai parameter pengguna untuk fleksibiliti).
Dalam port ini, tingkah laku penyimpangan diikat kepada KC MultFactor seperti dalam formula asal, tetapi anda boleh menyesuaikannya jika anda mahu gaya jalur yang berbeza.
KC Length
Tempoh untuk:
- garis tengah saluran volatiliti,
- pelicinan julat,
- tinggi/rendah tetingkap dan regresi pengimbas.
Mentakrifkan sejauh mana Pengimbas Tekanan melihat ke belakang untuk menganggarkan struktur volatiliti dan tekanan arah.
KC MultFactor
Mengawal lebar saluran volatiliti dan jalur luar.
- Nilai lebih besar → saluran lebih lebar, keadaan Tekanan AKTIF lebih sedikit.
- Nilai lebih kecil → saluran lebih ketat, isyarat tekanan lebih kerap.
Gunakan TrueRange (KC)
- benar → julat saluran menggunakan Julat Sebenar (menangkap jurang dan pergerakan tajam).
- palsu → julat hanyalah Tinggi − Rendah.
Ringkasan
Ulasan pelanggan
5 | 0 % | |
4 | 100 % | |
3 | 0 % | |
2 | 0 % | |
1 | 0 % |


