Penerangan
https://chartshots.spotware.com/c/695bec6c74055
https://chartshots.spotware.com/c/695bed35bf7b7
https://chartshots.spotware.com/c/695bed6b139df
https://chartshots.spotware.com/c/695bed8ea6bdb
📊 BLOK PEMECAH PIVOT
🤔
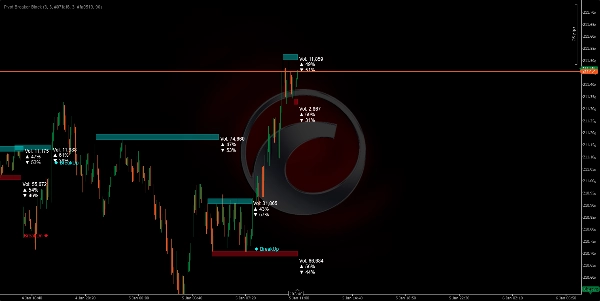
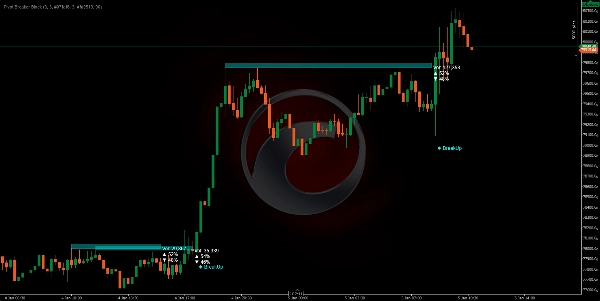
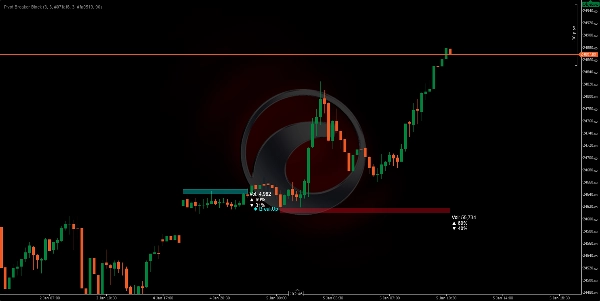
Blok Pemeah Pivot adalah penunjuk visual yang secara automatik mengenal pasti titik perubahan harga utama (tinggi dan rendah tempatan) dan membina "blok harga" di sekitar tahap kritikal ini. Apabila harga mendekati tahap serupa ini lagi, algoritma melukis segi empat tepat (zon) yang mewakili rintangan (Bekalan) dan sokongan (Permintaan) di kawasan tersebut.
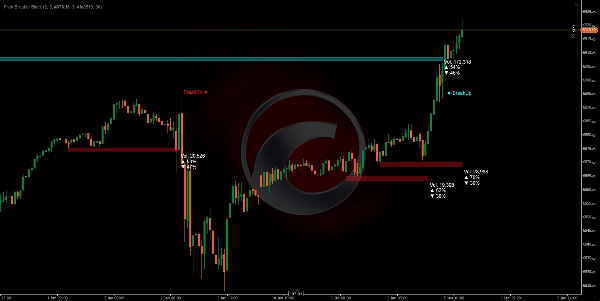
Sistem sentiasa memantau jika harga menembusi zon-zon ini, menghasilkan isyarat visual yang jelas: BreakUp (pecahan menaik) 🔼 atau BreakDn (pecahan menurun) 🔽.
APA GUNA NYA? 🎯
1. Kenal Pasti Zon Kawalan Pasaran 🗺️
Algoritma mengesan di mana harga telah menunjukkan rintangan kuat (siling jualan) atau sokongan (lantai pembelian). Apabila tahap ini muncul beberapa kali, pasaran mengesahkan kepentingannya.
2. Visualisasikan Pengumpulan dan Pengagihan Volum ⚖️
Setiap blok menunjukkan:
- Jumlah volum yang diproses dalam zon itu
- % pembelian (lilin menaik) 📈
- % penjualan (lilin menurun) 📉
Ini membolehkan anda melihat jika pasaran sedang membeli atau menjual dalam kawasan itu, mendedahkan niat pasaran.
3. Jangka Titik Pecahan 🚨
Apabila harga mendekati zon-zon ini, anda mempunyai kebarangkalian tertinggi untuk pergerakan signifikan berlaku. Algoritma secara automatik mengesan apabila harga menembusi zon tersebut, memberi amaran kepada anda dalam masa nyata.
BAGAIMANA LOGIK BERFUNGSI ⚙️
Fasa 1: Pengesanan Pivot (Titik Perubahan) 🔍
Algoritma mencari tinggi dan rendah yang memenuhi kriteria tertentu:
- Pivot Tinggi: Satu lilin yang tinggi adalah lebih tinggi daripada 5 lilin sebelumnya DAN 5 lilin berikutnya.
- Pivot Rendah: Satu lilin yang rendah adalah lebih rendah daripada 5 lilin sebelumnya DAN 5 lilin berikutnya.
Parameter "5" ini (Pivot Lookback) adalah boleh laras berdasarkan volatiliti yang anda ingin tangkap.
Fasa 2: Pengenalan Zon Kawalan 🎯
Setelah pivot dikenal pasti, sistem membandingkannya dengan pivot sebelumnya dari jenis yang sama. Jika perbezaan antara keduanya adalah kurang daripada 20% ATR (ukuran volatiliti semasa), ini bermakna pasaran sedang mengunjungi semula tahap serupa yang ditolak sebelum ini.
Fasa 3: Penentuan Saiz Zon 📏
Ketinggian setiap blok dikira secara dinamik menggunakan ATR (Julat Benar Purata):
- Bekalan (Merah): Siling adalah ATR × 0.5 mata di atas pivot.
- Permintaan (Sian): Lantai adalah ATR × 0.5 mata di bawah pivot.
Ini bermakna zon-zon secara automatik menyesuaikan dengan volatiliti aset. Dalam pasaran yang tidak stabil, zon lebih lebar; dalam pasaran yang tenang, ia lebih ketat.
Fasa 4: Analisis Volum Masa Nyata 💹
Semasa harga berada dalam zon, algoritma menjumlahkan semua volum beli dan jual sejak blok bermula:
- Beli: Semua lilin di mana penutupan adalah lebih tinggi daripada bukaan (volum menaik).
- Jual: Semua lilin di mana penutupan adalah lebih rendah daripada bukaan (volum menurun).
Peratusan ini menunjukkan kepada anda niat dominan dalam zon itu.
Fasa 5: Pengesanan Pecahan 🚀
Algoritma memantau setiap lilin baru:
- BreakUp (↑): Penutupan melintasi di atas siling Bekalan → Isyarat pecahan menaik.
- BreakDn (↓): Penutupan jatuh di bawah lantaian Permintaan → Isyarat pecahan menurun.
Apabila ini berlaku, blok dimatikan dan isyarat teks muncul di skrin.
CARA MENGGUNAKANNYA 🛠️
Pemasangan dan Konfigurasi ⚙️
- Tambah penunjuk ke platform cTrader anda.
- Akses parameter yang boleh laras:
ParameterMaksudCadangan
Pivot Lookback
Berapa banyak lilin kiri/kanan yang dinilai untuk mengesahkan pivot
5 (standard), tingkatkan pada TF yang lebih tinggi
Faktor Zon Bekalan
Ketinggian blok merah (Rintangan)
5.0 (standard), laraskan mengikut keutamaan
Faktor Zon Permintaan
Ketinggian blok sian (Sokongan)
5.0 (standard), laraskan mengikut keutamaan
Ketelusan
Ketelapan blok (0=tidak kelihatan, 255=pekat)
90 (disyorkan untuk keterlihatan)
Warna
Sesuaikan penampilan visual
Merah untuk Bekalan, Sian untuk Permintaan
Strategi Perdagangan 💡
Senario 1: Masuk Panjang (Beli) 📈
- Tunggu harga membentuk blok Permintaan (sian) dengan % pembelian > 55%.
- Apabila melihat BreakUp, sahkan kemasukan menaik anda.
- Stop Loss (SL) di bawah lantai blok.
Senario 2: Masuk Pendek (Jual) 📉
- Cari blok Bekalan (merah) dengan % penjualan > 55%.
- Pada BreakDn, buka posisi menurun.
- Stop Loss (SL) di atas siling blok.
Senario 3: Pembalikan (Purata Reversion) 🔄
- Jika harga berada dalam blok Permintaan tetapi % pembelian rendah (< 45%)...
- Jangka harga akan memantul naik tanpa mencapai BreakUp.
- Masuk beli berhampiran lantai dengan Take Profit (TP) di siling.
Jangka Masa Optimum ⏰
- H4/D1: Blok yang lebih signifikan, pergerakan jangka masa panjang.
- H1: Keseimbangan baik antara bunyi dan peluang.
- M15: Masuk cepat, memerlukan pengesahan volum.
Ringkasan
The indicator continuously monitors price action relative to these zones, providing real-time breakout signals: "BreakUp" for bullish breakouts above resistance and "BreakDn" for bearish breakouts below support. Each block displays cumulative volume data, including total volume processed and the percentage of buying (bullish) versus selling (bearish) activity, helping traders assess market intention within these areas.
Pivot Breaker Block supports multiple trading strategies, including breakout entries and mean reversion, with configurable parameters such as pivot lookback period, zone height factors, and visual transparency. It is suitable for various markets including Forex, indices, commodities, stocks, and cryptocurrencies, and works effectively on timeframes from 15 minutes to daily charts.
Key features:
- Automatic pivot detection with adjustable lookback
- Dynamic supply and demand zone sizing based on ATR
- Real-time volume accumulation and buy/sell ratio visualization
- Breakout alerts with on-screen signals
- Supports multiple asset classes and timeframes for versatile use