
Daily TPO profile
อินดิเคเตอร์
213 ดาวน์โหลด
เวอร์ชัน 1.0, Nov 2025
Windows, Mac
คำอธิบาย
โปรไฟล์ TPO รายวัน
ตัวบ่งชี้โปรไฟล์ TPO รายวันที่คำนวณ POC, VAH และ VAL สำหรับแต่ละเซสชัน
แสดงจุดควบคุมและพื้นที่มูลค่า 70% โดยตรงบนแผนภูมิ ช่วยให้คุณระบุโซนมูลค่ายุติธรรม ระดับแนวรับ/แนวต้านสำคัญ และพื้นที่ที่อาจเกิดการปฏิเสธหรือยอมรับราคา
วิธีการทำงาน
ตัวบ่งชี้นี้สร้าง โปรไฟล์ TPO (Time Price Opportunity) รายวัน คล้ายกับ Market Profile
สำหรับแต่ละแท่งของวันซื้อขาย มันจะ:
- แบ่งแกนราคาเป็น “ขั้นตอน” คงที่ที่กำหนดโดย “ขนาดแถว (pips)”
- สำหรับแต่ละขั้นตอนราคา นับจำนวนแท่งที่สัมผัสระดับนั้น (TPO = จำนวนครั้งที่ราคาซื้อขายที่นั่น)
- เมื่อสิ้นสุดวันจะคำนวณ:
-
- POC (จุดควบคุม) → ระดับราคาที่มีจำนวน TPO สูงสุด (ที่ตลาดใช้เวลามากที่สุด)
- VAH (ค่าสูงสุดของพื้นที่มูลค่า) และ VAL (ค่าต่ำสุดของพื้นที่มูลค่า) → ระดับราคาที่มีประมาณ เปอร์เซ็นต์พื้นที่มูลค่า (ค่าเริ่มต้น 70%) ของ TPO ทั้งหมดสำหรับเซสชันนั้น
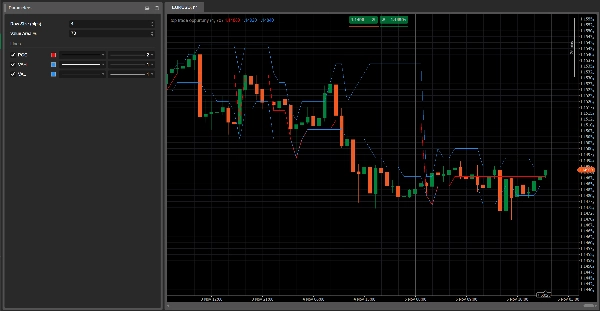
ตัวบ่งชี้จะแสดงเส้นแนวนอนสามเส้นบนแผนภูมิ:
- เส้นสีแดง → POC
- เส้นสีน้ำเงิน → VAH (บน) และ VAL (ล่าง)
เส้นเหล่านี้จะอัปเดตทีละแท่งในระหว่างเซสชันและรีเซ็ตเมื่อเริ่มวันซื้อขายใหม่
พารามิเตอร์หลัก
ขนาดแถว (pips)
กำหนดความหนาของแต่ละขั้นตอนราคาในโปรไฟล์-
- ค่าน้อย = โปรไฟล์ละเอียดมากขึ้น
- ค่ามาก = โปรไฟล์เรียบขึ้น
เปอร์เซ็นต์พื้นที่มูลค่า
เปอร์เซ็นต์ของ TPO ทั้งหมดที่อยู่ภายในพื้นที่มูลค่า (โดยปกติ 70%)
พื้นที่มูลค่าคือโซนราคาที่มีกิจกรรมตลาดส่วนใหญ่เกิดขึ้นในระหว่างวัน
วิธีอ่าน
- POC (เส้นสีแดง)
-
- ระดับราคาที่ตลาด “ยอมรับ” มากที่สุดในวันนั้น
- มักทำหน้าที่เป็น ระดับสมดุล: ราคาสามารถเด้ง หยุด หรือทะลุอย่างแรงในโซนนี้
- พื้นที่มูลค่า (VAH–VAL, เส้นสีน้ำเงิน)
-
- แทนโซน “มูลค่ายุติธรรม” ที่มีการซื้อขายส่วนใหญ่เกิดขึ้น
- การเคลื่อนไหวของราคาที่สัมพันธ์กับ VAH/VAL สามารถแสดง:
-
- การปฏิเสธ ราคาสุดขีด (การหลอกทะลุเกิน VAH/VAL)
- การยอมรับ ราคาที่ใหม่ (การรวมตัวนอกพื้นที่มูลค่า)
แนวคิดการใช้งานทั่วไป
- ราคา ปฏิเสธ VAL และเคลื่อนกลับเข้าสู่พื้นที่มูลค่า → แนวคิดซื้อระยะยาวที่เป็นไปได้ เดิมพันกับการกลับสู่ “มูลค่ายุติธรรม” (การกลับสู่ค่าเฉลี่ย)
- ราคา ทะลุเหนือ VAH ด้วยความแข็งแกร่ง และเริ่มสร้างโครงสร้างเหนือ → การเริ่มต้นที่เป็นไปได้ของ พื้นที่มูลค่าใหม่ที่สูงกว่า (สถานการณ์ตามแนวโน้ม)
- หลายวันที่มี POC อยู่รอบระดับเดียวกัน → โซนสมดุล/สะสมที่แข็งแกร่ง มักเป็นแนวรับ/แนวต้านสำคัญ
สรุป
สรุปโดย AI
The Daily TPO Profile indicator constructs a daily Time Price Opportunity (TPO) profile similar to a Market Profile, analyzing market activity by price levels throughout each trading session. It divides the price axis into fixed increments ("Row Size" in pips) and counts how many bars traded at each price step, representing TPOs. At the end of the session, it calculates three key levels: the Point of Control (POC), where the market spent the most time; the Value Area High (VAH); and the Value Area Low (VAL), which together define the price range containing approximately 70% of the trading activity.
The indicator plots these levels as horizontal lines on the chart—POC in red, VAH and VAL in blue—updating them bar by bar during the session and resetting daily. Traders use the POC as an equilibrium price level that may act as support or resistance. The Value Area highlights fair value zones, with price action near VAH and VAL signaling potential rejection or acceptance of price extremes. Typical applications include identifying mean reversion opportunities when price rejects VAL or trend-following setups when price breaks above VAH.
Main adjustable parameters include Row Size (pips), controlling profile detail, and Value Area %, defining the percentage of TPOs included in the value area. The indicator supports analysis across various markets including forex, indices, commodities, stocks, and cryptocurrencies.
โปรไฟล์อินดิเคเตอร์
รีวิวจากลูกค้า
0.0
รีวิว: 0
รีวิวจากลูกค้า
ยังไม่มีรีวิวสำหรับผลิตภัณฑ์นี้ หากเคยลองแล้ว ขอเชิญมาเป็นคนแรกที่บอกคนอื่น!
การสนทนา
คำถามที่พบบ่อย
Signal
Indices
Commodities
GBPUSD
RSI
Bollinger
Fibonacci
Scalping
AI
XAUUSD
NAS100
MACD
BTCUSD
Forex
Breakout
EURUSD
NZDUSD
Martingale
Prop
ZigZag
Supertrend
Fair Value Gap
SMC
Crypto
Grid
Stocks
ATR
USDJPY
VWAP
ผลิตภัณฑ์ที่มีให้บริการผ่าน cTrader Store รวมถึงบอทการเทรด อินดิเคเตอร์ และปลั๊กอิน มีให้บริการโดยนักพัฒนาบุคคลที่สามและมีไว้เพื่อวัตถุประสงค์ในการเข้าถึงข้อมูลและทางเทคนิคเท่านั้น cTrader Store ไม่ใช่โบรกเกอร์และไม่ได้ให้คำแนะนำการลงทุน คำแนะนำส่วนบุคคล หรือการรับประกันผลการดำเนินงานในอนาคต


ราคา
42.11M
ปริมาณการเทรด
6.13M
Pips ที่ได้กำไร
224
การขาย
8.41K
ติดตั้งฟรี