Opis
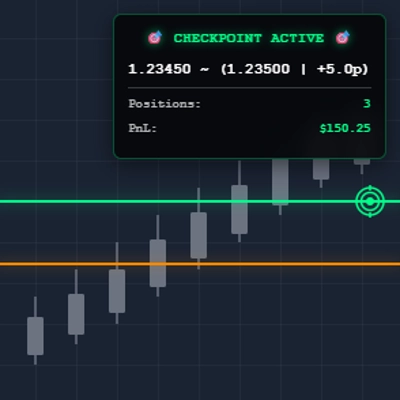
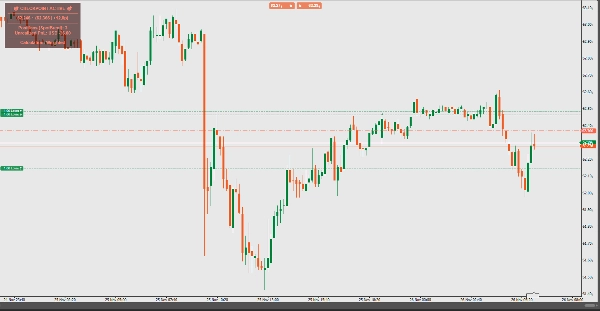
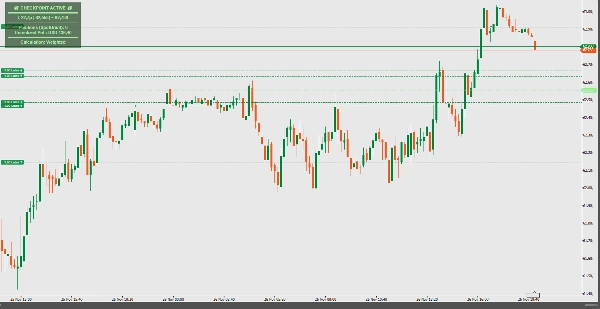
Wskaźnik Punktu Kontrolnego
Inteligentny kalkulator średniej ceny do zarządzania wieloma pozycjami. Wyświetla w czasie rzeczywistym poziomy progu rentowności z dynamiczną wizualną informacją zwrotną. Idealny dla traderów zarządzających wieloma wejściami na dowolnym instrumencie.
Kluczowe Funkcje:
- Obliczanie ważonej średniej w czasie rzeczywistym
- Inteligentny wyświetlacz linii (pokazuje się tylko przy 2+ pozycjach)
- Dynamiczne kolorowanie oparte na PnL (zielony/czerwony/biały)
- Wskaźnik siły w pipsach od aktualnej ceny
- Czysty, profesjonalny panel informacyjny
- Wydajność bez opóźnień
Jak To Działa:
Automatycznie oblicza średnią cenę Twojej pozycji, używając metody ważonej wolumenem lub prostej średniej. Wskaźnik wyświetla wyraźną linię poziomą oznaczającą punkt rentowności, gdy masz wiele pozycji, pomagając podejmować świadome decyzje handlowe na podstawie ogólnego stanu Twojej pozycji.
Idealny Dla:
- Traderów pozycyjnych skalujących wejścia/wyjścia
- Zarządzania portfelem na różnych instrumentach
- Zarządzania ryzykiem i ustawiania stop-lossów
- Wizualizacji punktu salda Twojego konta handlowego
Po prostu zastosuj na dowolnym wykresie i pozwól Checkpoint zająć się resztą – Twój punkt kontrolny handlu stał się prosty!
Podsumowanie
Profil wskaźnika
Opinie klientów
0.0
Opinie: 0
Opinie klientów
Ten produkt nie ma jeszcze opinii. Wypróbowałeś(-aś) go już? Bądź pierwszy(-a) i powiedz o tym innym!
Dyskusja
Częste pytania
BTCUSD
Forex
Indices
EURUSD
Commodities
GBPUSD
NZDUSD
Crypto
Stocks
XAUUSD
NAS100
USDJPY
Produkty dostępne za pośrednictwem cTrader Store, w tym boty handlowe, wskaźniki i wtyczki, dostarczane są przez deweloperów zewnętrznych i udostępniane wyłącznie w celach informacyjnych oraz w celu zapewnienia dostępu technicznego. cTrader Store nie jest brokerem i nie zapewnia doradztwa inwestycyjnego, nie udziela spersonalizowanych rekomendacji ani nie gwarantuje przyszłych wyników.
Więcej od tego autora


![Logo „Gaussian Channel [Iridio Capital]”](https://cdn.ctrader.com/image/webp/7c039209-5573-4a54-a072-f9528b503103_41960)


Cena
Od 28/12/2024
54
Bezpłatne instalacje