คำอธิบาย
คำอธิบายสั้น ๆ
แผนที่ระบอบแนวโน้ม & ปริมาณ เป็นตัวกรองระบอบสำหรับ cTrader ที่วัดทิศทางและความต่อเนื่องของทั้งราคาและปริมาณ มันให้คะแนนแนวโน้มที่ปรับมาตรฐานแล้วและคะแนนแนวโน้มปริมาณในช่วง –10 ถึง +10, ระบายสีแท่งเทียนของคุณด้วยการไล่ระดับสีที่นุ่มนวลจากสีแดงขาลงไปยังสีเขียวขาขึ้น และแสดงว่าสภาพแวดล้อมปัจจุบันเป็นความเสี่ยงเปิด, ความเสี่ยงปิด หรือแค่มีเสียงรบกวน
🧠 สิ่งที่มันทำ
ตัวบ่งชี้นี้จำลองตรรกะของ “Regime Filter” ของ BigBeluga จาก TradingView ปรับให้เหมาะสมกับ cTrader และห่อหุ้มในรูปแบบ แผนที่ระบอบแนวโน้ม & ปริมาณ ที่ชัดเจน
ราคา & ปริมาณที่ถูกปรับให้เรียบ
- คำนวณ HLC3 (ค่าเฉลี่ยของสูง, ต่ำ, ปิด) และใช้ Hull Moving Average (HMA) เพื่อปรับราคาให้เรียบ
- ใช้ Hull Moving Average อีกตัวหนึ่งกับปริมาณการเคาะ
คะแนนแนวโน้ม (ราคา)
- สำหรับ N แท่งล่าสุด (
Length) มันเปรียบเทียบ HMA ปัจจุบันของราคา กับค่า HMA ในอดีตแต่ละค่า:
- ถ้า HMA ปัจจุบัน > HMA ในอดีต → แนวโน้ม +1
- ถ้า HMA ปัจจุบัน ≤ HMA ในอดีต → แนวโน้ม –1
- คะแนนสะสมจะถูกปรับสเกลเป็น –10 … +10 → นี่คือ ค่าของแนวโน้ม.
คะแนนแนวโน้มปริมาณ
- ใช้ตรรกะเดียวกัน แต่ใช้กับ HMA ของปริมาณ.
- ผลลัพธ์คือคะแนนที่ปรับมาตรฐานอีกตัวในช่วง –10 … +10 → คือ ค่าของปริมาณ.
ตรรกะสี
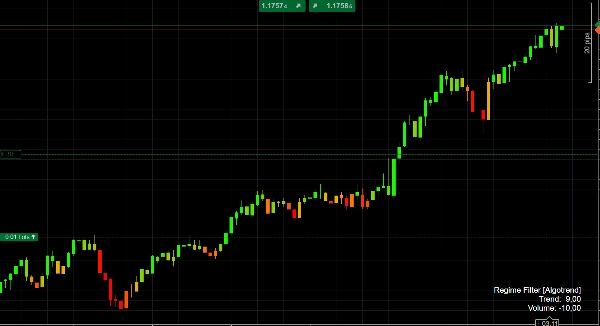
- เมื่อ คะแนนแนวโน้มเป็นลบ แท่งเทียนจะถูกระบายสีด้วยการไล่ระดับสี แดง → ส้ม ขึ้นอยู่กับความเข้มของระบอบขาลง
- เมื่อ คะแนนแนวโน้มเป็นบวก แท่งเทียนจะถูกระบายสี ส้ม → เขียวมะนาว โดยสีเขียวเข้มขึ้นสำหรับระบอบขาขึ้นที่แข็งแกร่งกว่า
นี่จะให้สัญญาณภาพทันทีว่าการเคลื่อนไหวของราคานั้น เป็นขาลง, เป็นกลาง หรือขาขึ้น และระบอบนั้นมีความต่อเนื่องมากน้อยเพียงใดในขณะนี้
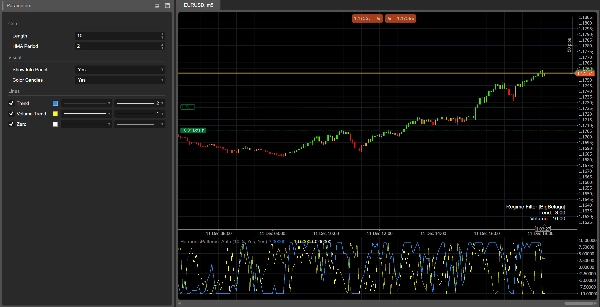
แผงระบอบ
ในหน้าต่างย่อย ตัวบ่งชี้จะแสดง:
- เส้นแนวโน้ม (สีน้ำเงิน)
- เส้นแนวโน้มปริมาณ (สีเทา)
- เส้นศูนย์ (เส้นฐาน)
ในแท่งสุดท้ายจะแสดง แผงข้อมูล เล็ก ๆ พร้อมค่าปัจจุบันของ แนวโน้ม และ ปริมาณ.
🎯 วิธีการใช้งาน
การยืนยันแนวโน้ม
- เทรดเฉพาะในทิศทางของระบอบที่แข็งแกร่ง เช่น:
- แนวโน้ม > +4 → มีแนวโน้มซื้อเท่านั้น
- แนวโน้ม < –4 → มีแนวโน้มขายเท่านั้น
ตัวกรองระบอบ
- ปิดหรือปรับลดกลยุทธ์ของคุณเมื่อระบอบอ่อนแอ (แนวโน้มใกล้ 0) หรือเมื่อ แนวโน้มปริมาณเป็นลบอย่างแรง ซึ่งมักบ่งชี้ถึงการเคลื่อนไหวที่ไม่แน่นอนหรือจางหาย
บริบทสำหรับสัญญาณ
รวมสัญญาณเข้าของคุณที่มีอยู่ (การเคลื่อนไหวของราคา, รูปแบบฮาร์มอนิก, ออสซิลเลเตอร์ ฯลฯ) กับ แผนที่ระบอบแนวโน้ม & ปริมาณ เป็น ตัวกรองระดับมหภาค:
- รับเฉพาะ การเบรกเอาต์ เมื่อแนวโน้มเป็นบวกและแนวโน้มปริมาณก็เป็นบวกด้วย
- หลีกเลี่ยง การตั้งค่าการกลับตัวเฉลี่ย เมื่อแนวโน้มแข็งแกร่งมาก (> +8 หรือ < –8) เพราะตลาดอยู่ในระบอบทิศทางที่ทรงพลัง
⚙️ พารามิเตอร์นำเข้า
แกนหลัก
Length
จำนวนแท่งที่ใช้สร้างคะแนนแนวโน้มและปริมาณ
- ค่าสูงขึ้น → ระบอบที่เรียบกว่าและ “มหภาค” มากขึ้น; เปลี่ยนแปลงช้าลงแต่มั่นคงกว่า
- ค่าต่ำลง → ตอบสนองเร็วขึ้น แต่มีเสียงรบกวนและการเปลี่ยนแปลงบ่อยขึ้น
HMA Period
ช่วงของ Hull Moving Average ที่ใช้ปรับราคาและปริมาณให้เรียบ
- ปรับให้เหมาะสมกับกรอบเวลาของคุณและสไตล์การเทรด: สั้นสำหรับกรอบเวลาต่ำ, ยาวสำหรับกรอบเวลาสูง
ภาพ
แสดงแผงข้อมูล
แสดง/ซ่อนแผงข้อความเล็ก ๆ บนแท่งสุดท้ายพร้อมคะแนน แนวโน้ม และ ปริมาณ ปัจจุบันระบายสีแท่งเทียน
เปิดใช้งานการระบายสีแท่งเทียนตามค่า แนวโน้ม (ไล่ระดับสีแดง / ส้ม / เขียว) ปิดถ้าคุณต้องการเก็บสีแผนภูมิปกติของคุณ
✅ แผ่นช่วยตีความ
- แนวโน้ม ≥ +7 → ระบอบขาขึ้นที่แข็งแกร่ง, แท่งเทียนสีเขียวสดใส
- แนวโน้มระหว่าง +3 ถึง +7 → แนวโน้มขาขึ้น; การดึงกลับเป็นโซนซื้อจังหวะ
- แนวโน้มระหว่าง –3 ถึง +3 → แนวโน้มด้านข้าง / ผันผวน; สัญญาณน่าเชื่อถือน้อยลง
- แนวโน้ม ≤ –7 → ระบอบขาลงที่แข็งแกร่ง, แท่งเทียนสีแดงเข้ม
- แนวโน้มปริมาณ > 0 → กิจกรรมเพิ่มขึ้น / คงที่, การเคลื่อนไหวมีแนวโน้มเป็น “จริง” และต่อเนื่อง
- แนวโน้มปริมาณ < 0 → การมีส่วนร่วมลดลง, ความเสี่ยงสูงของการเคลื่อนไหวปลอม, ผันผวน หรือกลับตัว
สรุป
รีวิวจากลูกค้า
5 | 0 % | |
4 | 100 % | |
3 | 0 % | |
2 | 0 % | |
1 | 0 % |


