
คำอธิบาย
ตัวบ่งชี้ที่สะอาด เรียบง่าย และมีภาพที่ชัดเจนซึ่งตรวจจับการตัดกันระหว่างค่าเฉลี่ยเคลื่อนที่แบบง่าย (SMA) สองเส้นและแสดงทุกอย่างอย่างชัดเจนบนกราฟ
คุณสมบัติหลัก:
- ลูกศรสีขนาดใหญ่ที่จุดตัดกันที่แม่นยำ → สีเขียวมะนาว ↑ → การตัดกันแบบขาขึ้น (มีโอกาสซื้อ) → สีแดง ↓ → การตัดกันแบบขาลง (มีโอกาสขาย)
- แผงสถานะถาวรที่ มุมขวาบน ของกราฟ → ประเภทของการตัดกันล่าสุด (ขาขึ้น / ขาลง / รอ) → วันที่และเวลาที่แน่นอนของการตัดกัน → ช่วงเวลาที่ตั้งค่าของค่าเฉลี่ยเคลื่อนที่
- ไม่ทาสีซ้ำ 100%
- ป้องกันสัญญาณซ้ำบนแท่งเดียวกัน
- พิมพ์ข้อความลงในบันทึกทุกครั้งที่เกิดการตัดกัน (ดีสำหรับการติดตาม)
- น้ำหนักเบามาก – ทำงานได้อย่างสมบูรณ์แบบบนทุกช่วงเวลา
วิธีที่ฉันชอบใช้ (และแนะนำ):
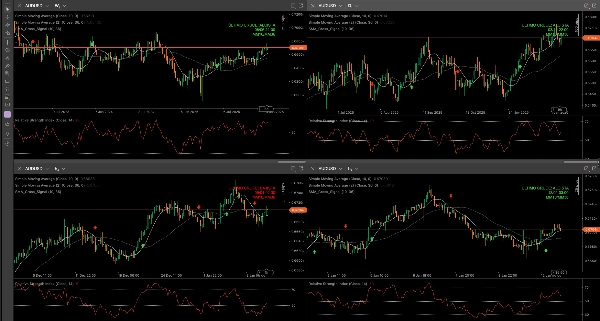
ฉันใช้พร้อมกันบน รายสัปดาห์, รายวัน, H4 และ H1 ช่วงเวลาของคู่สกุลเงินเดียวกัน
ฉันส่วนใหญ่ทำรายการบน H1 แต่การมีตัวบ่งชี้บนช่วงเวลาที่สูงกว่าทำให้ฉันมี มุมมองโดยรวมที่ทรงพลังมาก ของทิศทางหลักของคู่สกุลเงิน:
- การตัดกันแบบขาขึ้น/ขาลงสอดคล้องกันระหว่างรายสัปดาห์และรายวันหรือไม่? → โอกาสสูงขึ้น
- สัญญาณขัดแย้งระหว่างช่วงเวลาหรือไม่? → ควรรอหรือลดขนาดตำแหน่ง
การตั้งค่าที่นิยมซึ่งทำงานได้ดี:
- 9 / 21
- 10 / 30
- 21 / 50
- 50 / 200 (มีประโยชน์โดยเฉพาะบนกราฟรายสัปดาห์และรายวัน)
เหมาะสำหรับทั้งผู้เริ่มต้น (ขอบคุณภาพที่ชัดเจนและความเรียบง่าย) และเทรดเดอร์ที่มีประสบการณ์ที่มองหาฐานที่สะอาดเพื่อผสมผสานกับ Price Action, แนวรับ/แนวต้าน หรือปริมาณ
ฟรีสำหรับชุมชน cTrader ทั้งหมด!
ลองใช้บนเดโม ใช้งานในโหมดหลายช่วงเวลา และถ้าคุณชอบ… อย่าลังเลที่จะฝากความคิดเห็นพร้อมการตั้งค่าที่คุณชื่นชอบหรือคู่สกุลเงินที่มันทำงานได้ดีที่สุดสำหรับคุณ 😊
ขอให้ทุกคนเทรดอย่างมีความสุข!
สรุป
Key features include non-repainting signals, prevention of duplicate alerts on the same bar, and log messages for each crossover event. The indicator is lightweight and compatible with any timeframe, making it suitable for multi-timeframe analysis. Commonly used SMA period pairs include 9/21, 10/30, 21/50, and 50/200, with the latter especially useful on weekly and daily charts.
Traders often apply the indicator simultaneously on weekly, daily, 4-hour, and 1-hour timeframes to gain a comprehensive view of market direction and improve entry timing. It supports various markets including Forex and popular symbols like EURUSD, GBPUSD, USDJPY, XAUUSD, and BTCUSD. The indicator is designed for both beginners and experienced traders seeking clear, straightforward moving average crossover signals.


