
Описание
Meravith Auto — это автоматизированная версия ручной торговой системы Meravith.
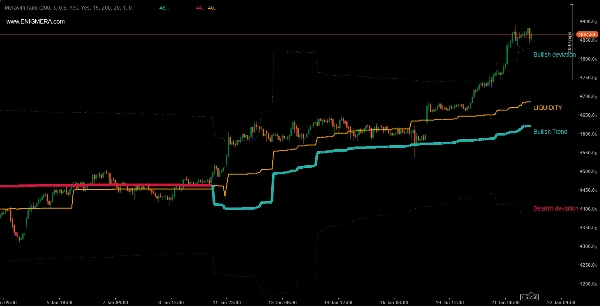
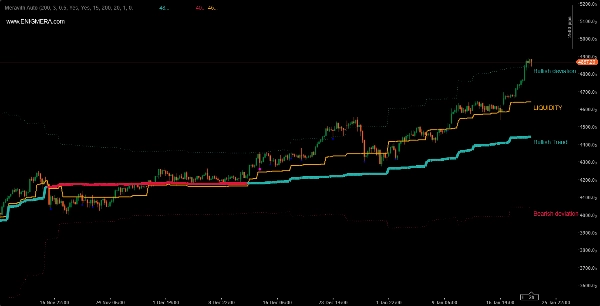
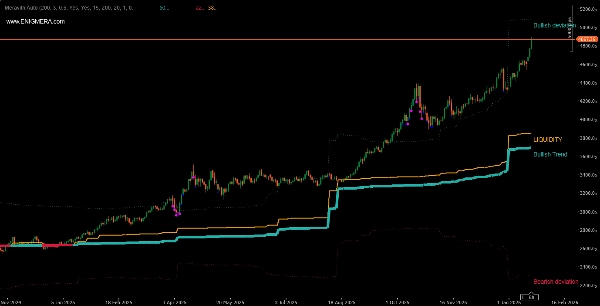
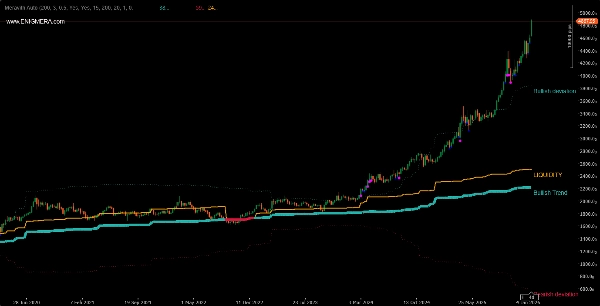
Индикатор состоит из:
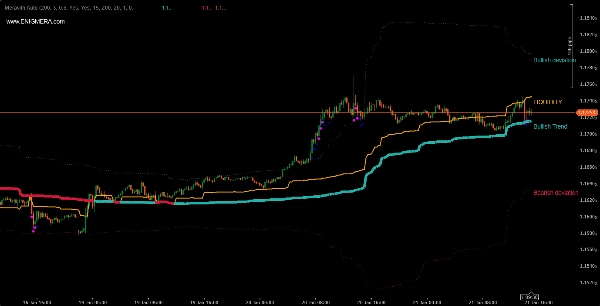
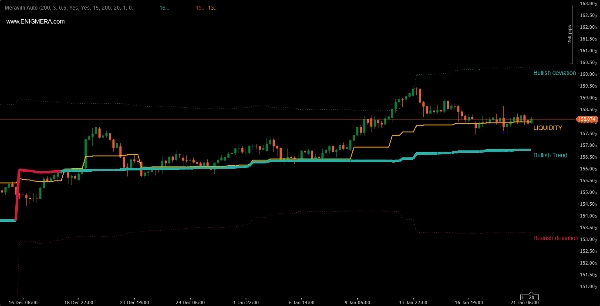
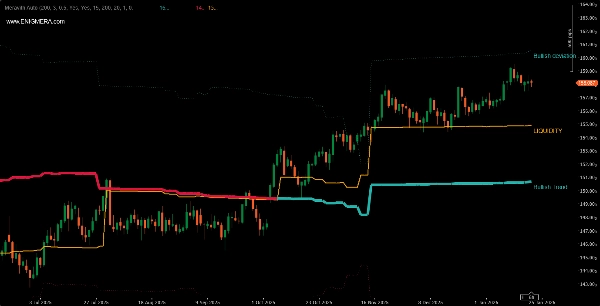
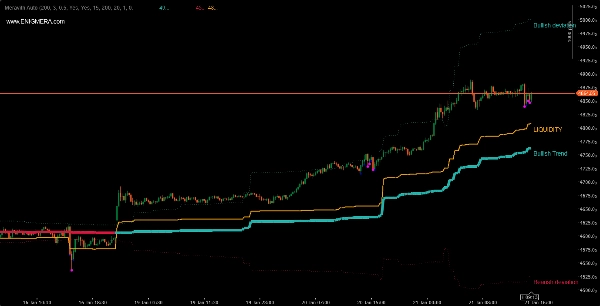
- Трендовой линии, которая меняет цвет. Когда бычий тренд — она зелёная, когда медвежий — красная. Это линия поддержки тренда.
- Линии ликвидности, где объём бычьего равен объёму медвежьего.
- Линии тройного бычьего отклонения.
- Линии тройного медвежьего отклонения.
- Фиолетовые и синие точки, указывающие на высокий объём. Фиолетовая точка означает объём больше на два отклонения от среднего объёма, а синяя — на два отклонения.
Как использовать?
- Бычья трендовая линия плюс ликвидность выше трендовой линии означает бычий тренд. Ожидается движение рынка вверх. Открываем длинные позиции.
- Медвежья трендовая линия плюс ликвидность ниже трендовой линии означает медвежий тренд. Ожидается движение рынка вниз. Открываем короткие позиции.
Комбинируйте его по своему усмотрению с другими индикаторами.
Индикатор можно использовать на любой паре и любом таймфрейме.
Вы можете увидеть разные результаты у разных брокеров из-за объёмов, которые они котируют.
Предпочтительнее крупные брокеры из-за большего объёма.
В чём разница между автоматизированной и ручной версиями?
- В ручной версии мы оцениваем тренд на основе максимумов и минимумов. Соответственно, она также показывает уровни истощения объёма на рынке.
- В автоматизированной версии период меняется в зависимости от различных фаз рынка. Он может быть коротким при высокой волатильности и длинным при низкой. Здесь нет уровней истощения, так как анализируется не тренд, а период. По этой причине используются отклонения. По умолчанию отображается тройное отклонение.
Сводка
Профиль индикатора
Отзывы покупателей
0.0
Отзывы: 0
Отзывы покупателей
У этого продукта еще нет отзывов. Уже попробовали его? Поделитесь впечатлениями!
Обсуждение
Частые вопросы
BTCUSD
Forex
Signal
Breakout
Indices
EURUSD
Commodities
GBPUSD
NZDUSD
Prop
Scalping
Crypto
Stocks
XAUUSD
NAS100
USDJPY
VWAP
Продукты, доступные в cTrader Store, включая торговых ботов, индикаторы и плагины, предоставляются сторонними разработчиками и доступны исключительно в информационных и технических целях. cTrader Store не является брокером и не предоставляет инвестиционные консультации, персональные рекомендации или какие-либо гарантии будущей доходности.


Цена
С 24/10/2025