
STC
อินดิเคเตอร์
278 ดาวน์โหลด
เวอร์ชัน 1.0, Jan 2025
Windows, Mac
5.0
รีวิว: 2
คำอธิบาย
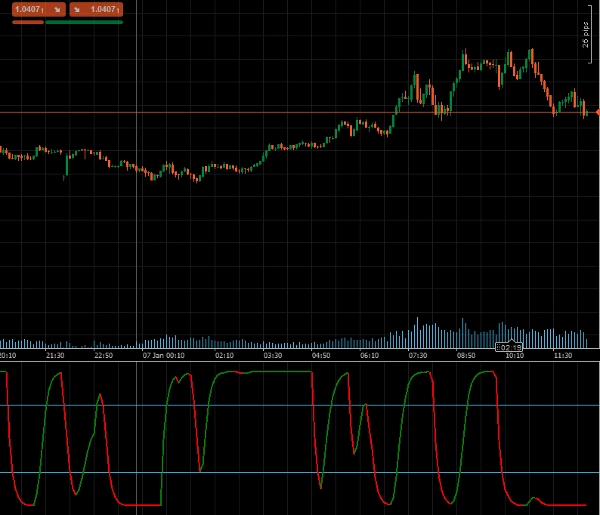
Schaff Trend Cycle (STC), พัฒนาโดยนักวิเคราะห์ทางเทคนิคที่มีชื่อเสียง Doug Schaff เป็นตัวบ่งชี้การซื้อขายขั้นสูงที่ออกแบบมาเพื่อระบุแนวโน้มตลาดและการกลับตัวด้วยความรวดเร็วและความแม่นยำอย่างยอดเยี่ยม โดยมีพื้นฐานจากแนวคิดนวัตกรรมในการรวมส่วนประกอบของแนวโน้มและวัฏจักร STC ใช้ค่าเฉลี่ยเคลื่อนที่แบบเลขชี้กำลัง (EMAs) และการคำนวณแบบสโตแคสติกเพื่อเอาชนะข้อจำกัดของตัวบ่งชี้ที่ล่าช้าเช่น MACD หรือ Stochastic Oscillator วิธีการที่เป็นเอกลักษณ์นี้ให้สัญญาณการซื้อขายที่เร็วกว่าและน่าเชื่อถือมากขึ้น มอบข้อได้เปรียบที่สำคัญในการตรวจจับแนวโน้มและการวิเคราะห์ตลาด
คุณสมบัติหลัก:
- การตรวจจับแนวโน้มล่วงหน้า: รวมค่าเฉลี่ยเคลื่อนที่แบบเลขชี้กำลัง (EMAs) กับการคำนวณแบบสโตแคสติกเพื่อจับแนวโน้มได้เร็วขึ้น
- การตั้งค่าที่ปรับแต่งได้: ปรับความยาว MA เร็ว MA ช้า ประเภท MA และปัจจัยการปรับเรียบให้เหมาะกับกลยุทธ์การซื้อขายของคุณ
- การแจ้งเตือนด้วยภาพ: การเปลี่ยนสีแบบไดนามิกแสดงถึงแนวโน้มขาขึ้นหรือขาลง ทำให้ง่ายต่อการตีความสภาพตลาด
- รองรับระดับซื้อเกิน/ขายเกิน: ระดับในตัว (25 และ 75) ช่วยระบุจุดกลับตัวของตลาดที่เป็นไปได้
พารามิเตอร์
- ความยาว: กำหนดจำนวนช่วงเวลาสำหรับการคำนวณแนวโน้ม
- ความยาว MA เร็ว: กำหนดความยาวของค่าเฉลี่ยเคลื่อนที่เร็ว
- ความยาว MA ช้า: ระบุความยาวของค่าเฉลี่ยเคลื่อนที่ช้า
- ประเภท MA: อนุญาตให้เลือกประเภทของค่าเฉลี่ยเคลื่อนที่ (เช่น EMA, SMA)
- ปัจจัยการปรับเรียบ: ปรับปัจจัยการปรับเรียบเพื่อสัญญาณแนวโน้มที่ละเอียดขึ้น
ผลลัพธ์
- STC: แสดงค่าหลักของ Schaff Trend Cycle ซึ่งแสดงทิศทางและความแข็งแกร่งของแนวโน้ม สำหรับการใช้งานในระบบซื้อขายอัตโนมัติ
- STCBull: เน้นสภาวะแนวโน้มขาขึ้น
- STCBear: เน้นสภาวะแนวโน้มขาลง
สรุป
โปรไฟล์อินดิเคเตอร์
รีวิวจากลูกค้า
5.0
รีวิว: 2
5 | 100 % | |
4 | 0 % | |
3 | 0 % | |
2 | 0 % | |
1 | 0 % |
รีวิวจากลูกค้า
August 12, 2025
Pros: Fast and accurate trend detection, earlier signals than MACD, customizable levels. Cons: No alerts, no MTF mode, no trade statistics.
การสนทนา
คำถามที่พบบ่อย
MACD
ผลิตภัณฑ์ที่มีให้บริการผ่าน cTrader Store รวมถึงบอทการเทรด อินดิเคเตอร์ และปลั๊กอิน มีให้บริการโดยนักพัฒนาบุคคลที่สามและมีไว้เพื่อวัตถุประสงค์ในการเข้าถึงข้อมูลและทางเทคนิคเท่านั้น cTrader Store ไม่ใช่โบรกเกอร์และไม่ได้ให้คำแนะนำการลงทุน คำแนะนำส่วนบุคคล หรือการรับประกันผลการดำเนินงานในอนาคต
เพิ่มเติมจากผู้เขียนคนนี้


ราคา
ตั้งแต่ 24/09/2024
4.46K
ติดตั้งฟรี