Описание
ЧТО ОН ДЕЛАЕТ
Поддержка и сопротивление на основе ликвидности определяет, где цена действительно развернулась — а не просто где можно провести линии.
Он обнаруживает точки разворота на вашем графике, сопоставляет их с психологическими уровнями круглых чисел и количественно оценивает активность покупок/продаж в каждой зоне. Вы видите, какие уровни показывают значимую ликвидность, а какие — просто пустые линии.
Результат — поддержка и сопротивление с контекстом — встроенными смещением, поглощением объема, эффективностью и практической интерпретацией.
ПОЧЕМУ ЭТО ВАЖНО
Традиционные методы поддержки и сопротивления имеют общий недостаток: они показывают вам где была цена, но ничего не говорят о том, что там произошло.
Уровень цены, к которому цена касалась дважды, и уровень, проверенный пятнадцать раз с большим объемом, выглядят одинаково на стандартном индикаторе поддержки и сопротивления. Но они ведут себя очень по-разному, когда цена возвращается.
Проблема
Проведение линий на точках разворота — это просто. Понять, удержатся ли эти уровни, пробьются или станут ловушкой для трейдеров, требует более глубокого анализа, которого большинство инструментов поддержки и сопротивления не предоставляют:
- Сколько на самом деле произошло разворотов на уровне?
- Кто доминировал — покупатели или продавцы?
- Было ли отторжение эффективным или потребовалось большое поглощение объема?
- Накопляет ли уровень энергию для прорыва или распределяется перед неудачей?
Решение
Этот индикатор измеряет подпись ликвидности на каждом уровне — сколько разворотов произошло, насколько глубоко они были, сколько объема участвовало и кто работал эффективнее — покупатели или продавцы.
Вместо угадывания, какие уровни важны, вы видите точно, что рынок делал в каждой зоне.
КАК ЭТО РАБОТАЕТ
Адаптивное обнаружение разворотов
Индикатор использует метод сглаживания на основе регрессии для фильтрации рыночного шума и выявления подлинных точек разворота — моментов, когда цена действительно изменила направление, а не случайных фитилей.
Доступны три режима обнаружения:
- Основной — Только подтвержденные, с высокой уверенностью развороты
- Стандартный — Вся основная структура разворотов
- Второстепенный — Включает внутренние развороты для детального анализа
Отображение зон круглых чисел
Точки разворота автоматически сопоставляются с психологическими ценовыми уровнями. Расстояние между зонами адаптируется к волатильности вашего инструмента на основе средней глубины разворота — ручная настройка не требуется.
Установите множитель в ноль, и индикатор автоматически рассчитает оптимальное расстояние.
Метрики ликвидности
В каждой зоне индикатор рассчитывает:
- Глубину — Насколько далеко цена прошла от точки разворота (в пунктах)
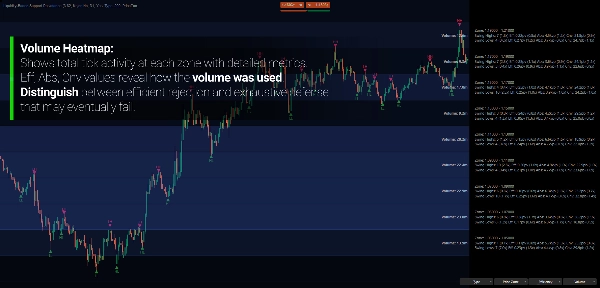
- Объем — Общая активность тиков во время разворота
- Эффективность — Движение цены на единицу объема (измеряет эффективность исполнения)
- Поглощение — Объем, необходимый для сдерживания движения цены (усилие удержания уровня)
- Уверенность — Движение цены за бар (импульс и обязательство)
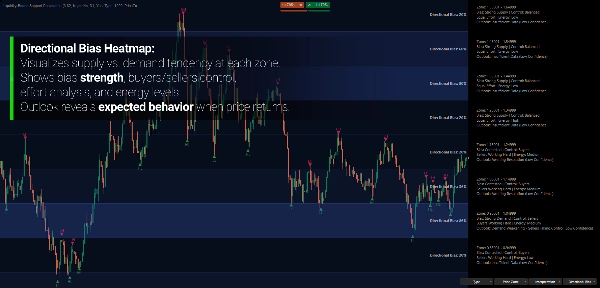
Направленный анализ
Каждая зона анализируется по:
- Смещению — Это зона предложения (больше максимумов) или спроса (больше минимумов)?
- Контролю — Кто работает эффективнее здесь — покупатели или продавцы?
- Энергии — Насколько велика общая активность по сравнению с базовым уровнем?
Эти метрики объединяются для создания понятной интерпретации того, что происходит на каждом уровне.
КЛЮЧЕВЫЕ ОСОБЕННОСТИ
Несколько режимов меток
- Цена — Простая идентификация зоны
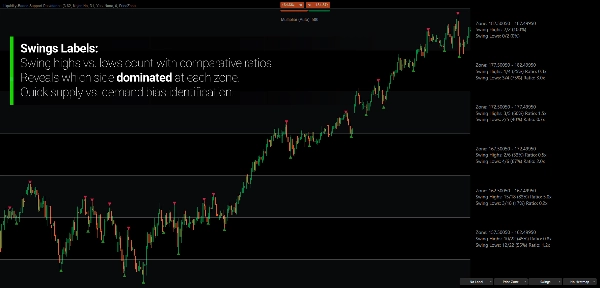
- Развороты — Подсчет максимумов и минимумов с соотношениями
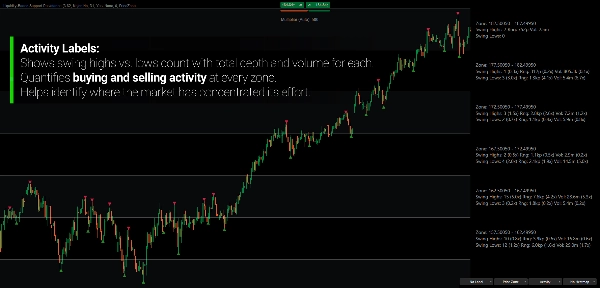
- Активность — Глубина, объем и сравнительные соотношения
- Эффективность — Рассчитанные метрики, показывающие институциональную точность
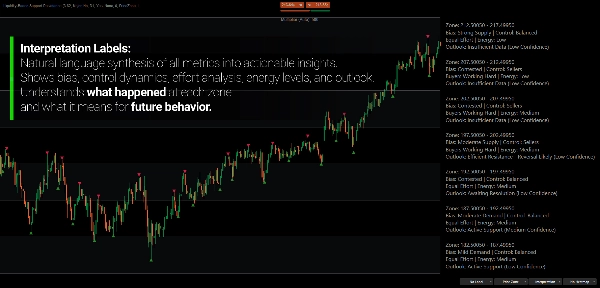
- Интерпретация — Анализ естественным языком смещения, контроля и перспектив
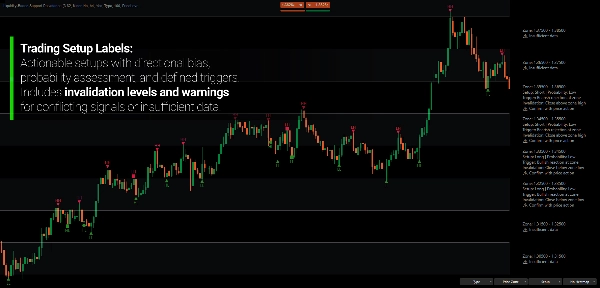
- Настройка — Практическая торговая настройка с триггером, аннулированием и вероятностью
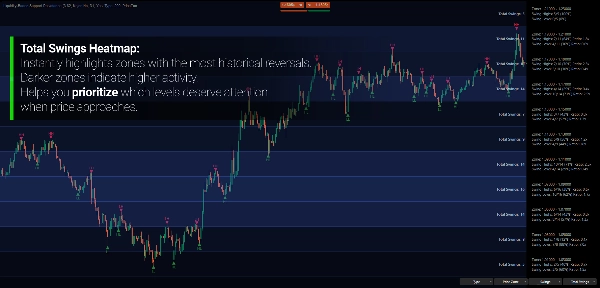
Визуализация тепловой карты
Преобразуйте необработанные данные в мгновенное визуальное понимание. Тепловая карта кодирует любую метрику по всем видимым зонам с использованием трехцветного градиента — холодный, средний, горячий.
Вместо того чтобы читать числа на каждом уровне, вы видите шаблоны с первого взгляда:
- Где концентрируется объем?
- Какие зоны показывают сильное направленное смещение?
- Где эффективность наивысшая?
- Какие уровни поглотили наибольшее усилие?
Доступно 17 режимов тепловой карты:
- Активность — Общее число разворотов, максимумы и минимумы
- Соотношения — Соотношение максимумов/минимумов, глубина, объем, длительность
- Исходные метрики — Глубина, объем
- Вычисляемые — Эффективность, поглощение, уверенность, направленное смещение
Многофреймовый анализ
Анализируйте структуру разворотов на более высоком таймфрейме, наблюдая при этом ценовое движение на более низком. Видите дневную активность разворотов, сопоставленную с зонами H1 без переключения графиков.
Двойной режим отображения
- Ценовой уровень — Традиционная одиночная линия на круглое число
- Ценовая зона — Верхняя и нижняя границы, показывающие полную ширину зоны
Адаптивное расстояние между зонами
Установите множитель в ноль, и индикатор автоматически рассчитает оптимальную ширину зоны на основе средней глубины разворота вашего инструмента. Работает с форекс, индексами, криптовалютами и товарами без ручной настройки.
РЕЖИМ ИНТЕРПРЕТАЦИИ И НАСТРОЙКИ
Индикатор не просто показывает данные — он синтезирует метрики в анализ, на который можно опираться.
Режим интерпретации предоставляет:
- Оценку смещения (сильное/умеренное/слабое предложение или спрос)
- Идентификацию контроля (покупатели, продавцы или баланс)
- Анализ усилий (кто больше работает, чтобы удержать позицию)
- Уровень энергии (высокий/средний/низкий относительно базового уровня)
- Прогноз, описывающий вероятное поведение
Режим настройки идет дальше:
- Направленное смещение (лонг, шорт или нейтрально)
- Условие входа
- Критерии аннулирования
- Оценка вероятности (высокая/средняя/низкая/очень низкая)
- Предупреждение при конфликте сигналов
Пример вывода:
"Настройка: Лонг | Вероятность: Средняя" "Триггер: Пробой и закрытие выше зоны" "Аннулирование: Закрытие обратно ниже зоны"
ЧТЕНИЕ ЗОН
Зона предложения — Больше максимумов, чем минимумов. Цена здесь склонна к развороту вниз. Продавцы исторически защищали этот уровень.
Зона спроса — Больше минимумов, чем максимумов. Цена здесь склонна к развороту вверх. Покупатели исторически защищали этот уровень.
Оспариваемая зона — Примерно равное количество максимумов и минимумов. Нет явного направленного смещения. Часто приводит к взрывным движениям после разрешения конфликта.
Высокая энергия — Значительное поглощение объема относительно базового уровня. Уровень активно оспаривается.
Низкая энергия — Минимальная активность. Уровень может легко пробиться или просто игнорироваться.
Дисбаланс эффективности — Когда одна сторона двигает цену дальше на единицу объема, она контролирует ситуацию независимо от того, кто прилагает больше усилий.
ДЛЯ КОГО ЭТО
Этот индикатор предназначен для трейдеров, которые хотят видеть контекст своих уровней, а не просто линии на графике.
Он хорошо подходит для трейдеров, ориентированных на структуру, которые включают в свои решения такие концепции, как анализ объема, соотношение усилий и результата или динамика спроса и предложения.
Свинг-трейдеры и позиционные трейдеры получат пользу, видя, какие уровни имеют институциональный вес, прежде чем планировать входы вокруг них.
Аналитики с несколькими таймфреймами могут просматривать структуру ликвидности более высокого таймфрейма прямо на графиках исполнения.
Это не генератор сигналов. Это контекстуальная рамка для понимания того, что рынок делал на ключевых ценовых уровнях — и что это говорит о будущем поведении.
ЧТО ДЕЛАЕТ ЕГО ОСОБЕННЫМ
Большинство индикаторов поддержки и сопротивления отвечают на вопрос: "Где цена развернулась?"
Этот индикатор отвечает: "Что произошло, когда цена там развернулась, и что это нам говорит?"
Квантируя активность на каждом уровне — а не просто отмечая, где произошли развороты — вы получаете понимание:
- Удержится ли уровень или пробьется
- Какая сторона работала эффективнее
- Накопляется ли энергия для прорыва или наступает истощение
- Как структурировать сделку вокруг уровня с определенным триггером и аннулированием
Анализ адаптируется к вашему инструменту автоматически. Оптимизация не требуется — параметры задает структура рынка.
---
ПОНИМАНИЕ ЛИКВИДНОСТИ НА ЦЕНОВЫХ УРОВНЯХ
Поддержка и сопротивление — это не волшебные линии, от которых отскакивает цена. Это зоны, где концентрируются противоположные интересы.
На уровне поддержки покупатели исторически были готовы поглощать давление продаж. На уровне сопротивления продавцы поглощали давление покупок. Сила уровня зависит не от того, сколько раз он был затронут, а от того, сколько потребовалось для его удержания — и сохраняется ли эта защита.
Именно поэтому два уровня с одинаковой ценовой историей могут вести себя совершенно по-разному. Один мог поглотить огромный объем, чтобы удержаться — что говорит о возможном истощении. Другой мог отторгнуть цену без усилий — что говорит о сильной уверенности.
Индикаторы, построенные на этой концепции, не предсказывают, куда пойдет цена. Они помогают понять что уже произошло на ключевых уровнях, чтобы вы могли принимать лучшие решения при возвращении цены.
---
Примечание: Этот индикатор моделирует динамику ликвидности через взаимодействие тикового объема и цены — а не через прямые данные из книги заказов. Хотя тиковый объем отражает активность на уровне брокера, а не объем биржи, он надежно указывает на относительные уровни участия и коррелирует с реальными рыночными объемами.
Торговля связана с риском. Этот индикатор является инструментом технического анализа — всегда применяйте надлежащее управление рисками.


