
คำอธิบาย
HiLo Marker: เปิดเผยจุดเปลี่ยนตลาดสำคัญ
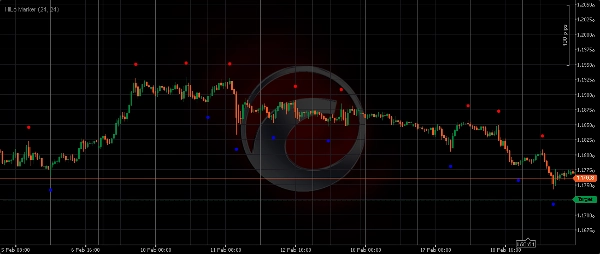
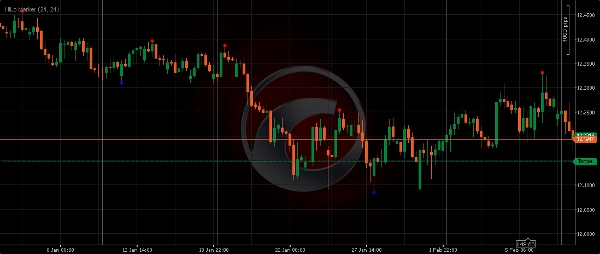
HiLo Marker เป็นตัวบ่งชี้ cTrader ที่ใช้งานง่ายและจำเป็น ออกแบบมาเพื่อตรวจจับและเน้นราคาสูงสุดและต่ำสุดที่สำคัญโดยอัตโนมัติบนพื้นฐานของหน้าต่างประวัติที่กำหนด เครื่องมือนี้ช่วยให้กราฟของคุณชัดเจนขึ้นโดยการตัดการเดาออกจากการระบุจุดสวิง มอบความได้เปรียบทางสายตาสำหรับผู้ซื้อขายราคาทุกคน
วิธีการทำงาน
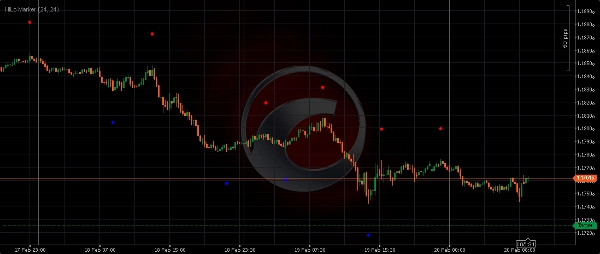
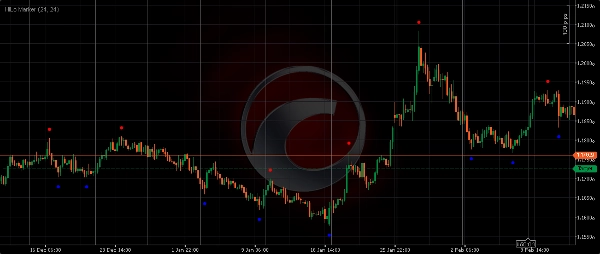
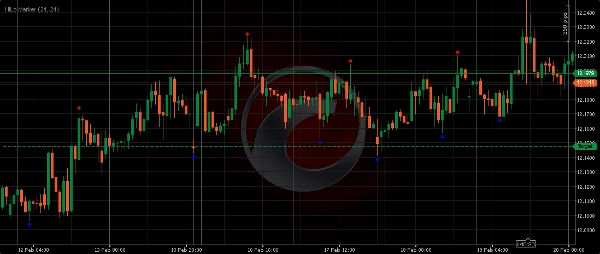
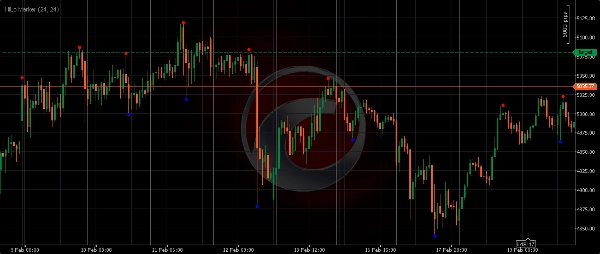
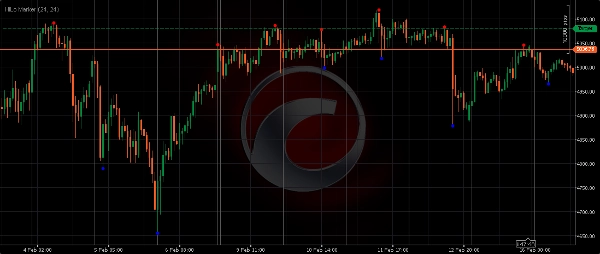
ตัวบ่งชี้จะสแกน "หน้าต่างระยะทาง" ที่ระบุ (จำนวนแท่งเทียน) เพื่อค้นหาราคาสูงสุดและต่ำสุดที่แท้จริงภายในช่วงนั้น เมื่อแท่งเทียนได้รับการยืนยันว่าเป็นจุดสูงสุดหรือต่ำสุดของหน้าต่างรอบข้าง HiLo Marker จะวางจุดสีแดงหรือสีน้ำเงินที่ชัดเจน (หรือเป็นลูกศร) เหนือ/ใต้แท่งเทียนนั้น วิธีนี้ช่วยให้คุณระบุระดับสำคัญที่ราคากลับตัวหรือพบแรงโมเมนตัมที่แข็งแกร่งได้อย่างเป็นกลาง
คุณสมบัติหลัก & ประโยชน์
- ความแม่นยำอัตโนมัติ: ไม่ต้องวาดเส้นด้วยตนเองอีกต่อไป HiLo Marker ระบุจุดเปลี่ยนที่สำคัญอย่างเป็นกลาง
- โครงสร้างตลาดที่ชัดเจน: มองเห็นสวิง แนวโน้ม และช่วงราคาได้ทันที ทำให้การวิเคราะห์กราฟมีประสิทธิภาพมากขึ้น
- โซนแนวรับ & แนวต้าน: ราคาสูงและต่ำที่ถูกทำเครื่องหมายมักทำหน้าที่เป็นแนวรับและแนวต้านในอนาคต ให้จุดเข้า/ออกที่มีความน่าจะเป็นสูง
- ใช้งานได้หลากหลาย: ทำงานได้อย่างสมบูรณ์แบบกับเครื่องมือทางการเงินทุกประเภท (Forex, ทองคำ, ดัชนี, Crypto, หุ้น) และทุกกรอบเวลา
- ปรับแต่งภาพได้: ปรับสีของเครื่องหมายและระยะออฟเซ็ตเพื่อการผสานกราฟที่สมบูรณ์แบบ
คำอธิบายพารามิเตอร์นำเข้า:
- ความยาว (ออฟเซ็ต): ค่านี้กำหนดระยะห่างเหนือราคาสูงสุดหรือต่ำกว่าราคาต่ำสุดที่เครื่องหมายจะถูกวาง ค่าใหญ่กว่าจะสร้างระยะห่างทางสายตามากขึ้นจากแท่งเทียน
-
- ตัวอย่าง:
Length = 24หมายความว่าเครื่องหมายจะปรากฏห่างจากราคาสูง/ต่ำจริง 24 พิปส์ (หรือทิก ขึ้นอยู่กับสัญลักษณ์)
- ตัวอย่าง:
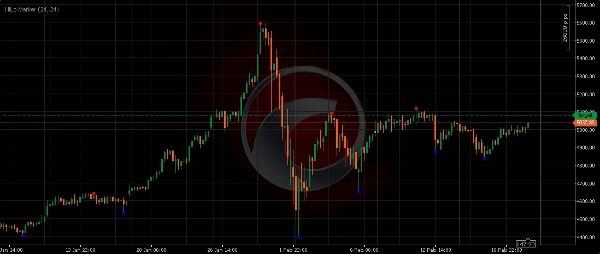
- หน้าต่างระยะทาง: นี่คือช่วงเวลาย้อนหลังที่ตัวบ่งชี้ใช้เพื่อระบุราคาสูงหรือต่ำ แท่งเทียนจะถูกทำเครื่องหมายเป็น Hi/Lo ก็ต่อเมื่อเป็นราคาสูงสุด/ต่ำสุดที่แท้จริงภายในจำนวนแท่งเทียนรอบข้างที่ระบุ
-
- Dist ขนาดเล็ก
Dist(เช่น 10-20): จับสวิงเล็กน้อยและเสียงรบกวนตลาดระยะสั้น (เหมาะสำหรับการสแคปปิ้ง) - Dist ขนาดใหญ่
Dist(เช่น 30-60+): ระบุสวิงที่สำคัญระดับสถาบันและการกลับตัวแนวโน้มหลัก (เหมาะสำหรับการเทรดสวิงหรือกรอบเวลาที่สูงขึ้น)
- Dist ขนาดเล็ก
ยกระดับการเทรดราคาของคุณด้วย HiLo Marker รับมุมมองที่ชัดเจนขึ้นเกี่ยวกับพลวัตของตลาดและตัดสินใจได้อย่างมีข้อมูล ดาวน์โหลดตอนนี้!
สรุป
รีวิวจากลูกค้า
5 | 0 % | |
4 | 100 % | |
3 | 0 % | |
2 | 0 % | |
1 | 0 % |


