คำอธิบาย
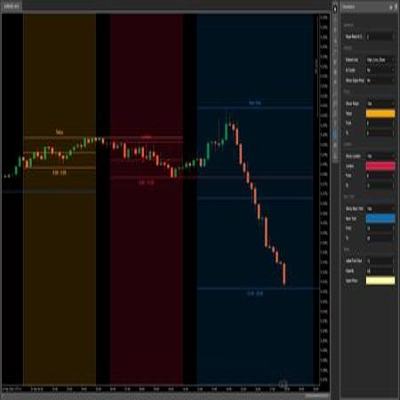
VoltyBands เป็นตัวบ่งชี้ที่ปรับตามความผันผวนซึ่งติดตามพฤติกรรมราคาตามเวลาจริงและแสดงภาพสภาพตลาดผ่านแถบบนและล่างที่ตอบสนอง แตกต่างจากตัวบ่งชี้ช่องทางแบบคงที่ VoltyBands ปรับเปลี่ยนแบบเรียลไทม์เพื่อสะท้อนการเปลี่ยนแปลงของความผันผวน ช่วยให้นักเทรดเข้าใจช่วงการขยายและหดตัวของราคาได้ดีขึ้น
โดยการรวมการคำนวณแถบที่ปรับได้กับเส้นสัญญาณที่ปรับเรียบได้ตามต้องการ VoltyBands มอบกรอบที่ชัดเจนสำหรับการวิเคราะห์โมเมนตัม การระบุโซนที่อาจเกิดการกลับตัว และการสังเกตช่วงการรวมตัว
คุณสมบัติหลัก
- แถบความผันผวนที่ปรับได้
แถบจะขยายและหดตัวโดยอัตโนมัติตามกิจกรรมตลาดปัจจุบัน - โหมดศูนย์กลางที่ศูนย์
ตัวเลือกในการแสดงการเคลื่อนไหวของราคาที่สัมพันธ์กับเส้นฐานกลางเพื่อความชัดเจนที่ดีขึ้น - ตัวเลือกการทำให้เป็นมาตรฐาน
ช่วยให้การปรับขนาดสม่ำเสมอ ทำให้ง่ายต่อการเปรียบเทียบสัญญาณระหว่างเครื่องมือและช่วงเวลาต่าง ๆ - ค่าเฉลี่ยเคลื่อนที่ในตัว
การปรับเรียบในตัวพร้อมวิธีการเลือกได้ (SMA, EMA, SMMA, LWMA) - การแสดงผลที่ปรับแต่งได้
เส้นกลางที่เลือกได้และการตั้งค่าการแสดงผลที่ยืดหยุ่น
วิธีการใช้งาน
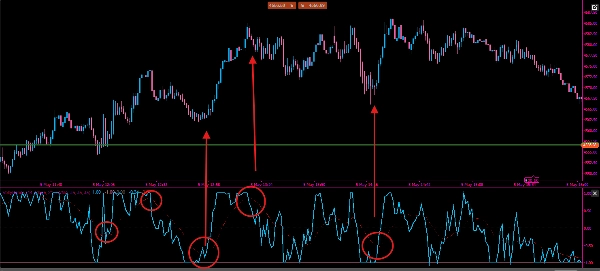
- การตรวจจับโมเมนตัม
ราคาที่เคลื่อนที่ใกล้แถบบนอาจบ่งชี้ถึงความแข็งแกร่งของตลาดขาขึ้น ขณะที่ความใกล้ชิดกับแถบล่างบ่งชี้แรงกดดันตลาดขาลง - โซนกลับตัว
การเบี่ยงเบนสุดขีดจากเส้นกลางสามารถเน้นพื้นที่ที่ราคาอาจกลับตัว - การวิเคราะห์ความผันผวน
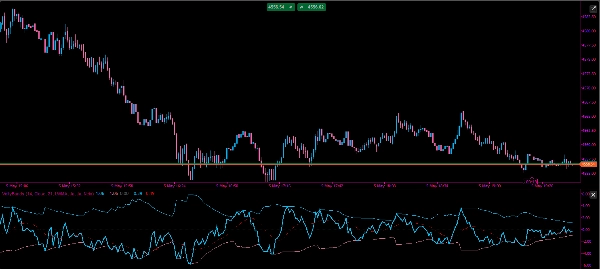
แถบที่ขยายกว้างขึ้นบ่งชี้ความผันผวนที่เพิ่มขึ้น; แถบที่แคบลงบ่งชี้การรวมตัว - การยืนยันสัญญาณ
ใช้ค่าเฉลี่ยเคลื่อนที่เป็นตัวกรองเพิ่มเติมสำหรับการเข้าและออก
พารามิเตอร์
- ความยาว – กำหนดความไวของการคำนวณความผันผวน
- แหล่งที่มา – ราคาขาเข้า (ปิด, เปิด ฯลฯ)
- ช่วง MA – ช่วงเวลาสำหรับเส้นปรับเรียบ
- วิธี MA – ประเภทค่าเฉลี่ยเคลื่อนที่ (SMA, EMA, SMMA, LWMA)
- แสดงเส้นกลาง – สลับเส้นกลาง
- ผูกศูนย์ – เปิดใช้งานการแสดงผลที่มีศูนย์เป็นฐาน
- ทำให้เป็นมาตรฐาน – เปิดใช้งานการปรับขนาดแบบมาตรฐาน
การใช้งานในทางปฏิบัติ
VoltyBands สามารถใช้ประเมินทั้งโมเมนตัมและโครงสร้างตลาดแบบเรียลไทม์ เมื่อราคายังคงอยู่ใกล้แถบบน จะบ่งชี้แรงกดดันตลาดขาขึ้นอย่างต่อเนื่อง ขณะที่การมีปฏิสัมพันธ์อย่างสม่ำเสมอกับแถบล่างบ่งชี้สภาพตลาดขาลง
ในตลาดที่เคลื่อนไหวแบบช่วง นักเทรดอาจมองหาราคาที่เคลื่อนที่ระหว่างแถบ โดยใช้ระดับภายนอกเป็นพื้นที่ที่อาจเกิดการกลับสู่ค่าเฉลี่ย ในทางตรงกันข้าม ในช่วงแนวโน้มที่แข็งแกร่ง ราคาอาจ “ขี่” ด้านใดด้านหนึ่งของแถบ ซึ่งบ่งชี้การต่อเนื่องมากกว่าการกลับตัว
เส้นกลางสามารถทำหน้าที่เป็นระดับสมดุลแบบไดนามิก การตัดผ่านเหนือหรือต่ำกว่าเส้นนี้อาจใช้เป็นสัญญาณทิศทาง โดยเฉพาะอย่างยิ่งเมื่อรวมกับค่าเฉลี่ยเคลื่อนที่ในตัวเพื่อยืนยัน
สำหรับโหมดที่ทำให้เป็นมาตรฐาน ค่าต่าง ๆ สามารถตีความได้ว่าเป็นจุดสุดขีดสัมพัทธ์ ทำให้ง่ายต่อการระบุสภาวะที่เกินขอบเขตไม่ว่าจะเป็นเครื่องมือหรือช่วงเวลาใด
เช่นเดียวกับตัวบ่งชี้ใด ๆ VoltyBands จะมีประสิทธิภาพสูงสุดเมื่อใช้ควบคู่กับการเคลื่อนไหวของราคาและเครื่องมือยืนยันเพิ่มเติม