「MeanReversion Indicator」ロゴ
MeanReversion Indicator
4.0
レビュー: 1
「MeanReversion Indicator」アップロード画像
登録日 21/02/2025
461.42M
取引数量
178.3K
獲得pips
10
販売
5.76K
無料インストール
Indicator profile
4.0
レビュー: 1
5
0 %
4
100 %
3
0 %
2
0 %
1
0 %
カスタマーレビュー
August 12, 2025
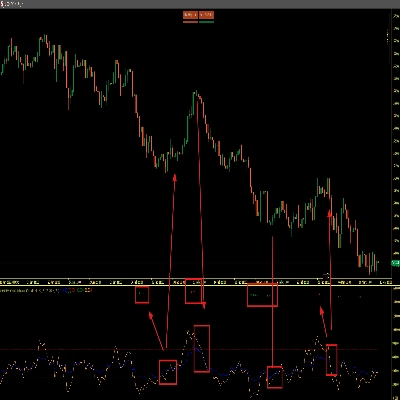
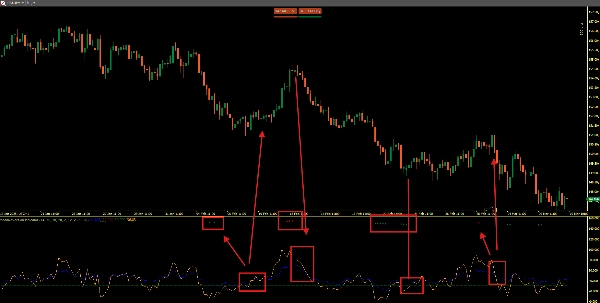
Pros: Adaptive moving average combining SMA with dynamic correlation to reduce lag and smooth price noise. Flexible sensitivity settings. Cons: No alerts or tooltips. No template saving. Can produce noise on low-end PCs or very short timeframes.
Products available through cTrader Store, including trading bots, indicators and plugins, are provided by third-party developers and made available for informational and technical access purposes only. cTrader Store is not a broker and does not provide investment advice, personal recommendations or any guarantee of future performance.

この作成者の他の商品

High-probability trading signals in the fast-paced world of forex and CFD trading.
High-Performance Renko Chart Indicator with Advanced filtering method.
「Rsi + Volume」ロゴ
5.0
(2)
無料
This indicator combines RSI (Relative Strength Index) with volume analysis to generate more reliable trading signals.
Automatic Elliott Wave Detection with Professional Filters
The Renko Moving Average Cross indicator combines classic EMA crossover signals with Renko-filtered prices.
Enhance Your Trading Strategy with the Larry Williams 9-5-3 Indicator
Engulfing Pattern Indicator
MA-RSI HTF Confirmation: Eliminate false signals and trade with confidence!
🚀 Simplify Your Trading Decisions With Powerful Technical Analysis.
PinBarCandlestickPattern Indicator
Hammer Pattern Indicator
Breakout Multi-Timeframe Strategy Indicator

これも好きかも

The Matrix Trend Heatmap pro, Turn your chart into a real-time market mood board — instant trend direction.
Trend & Volume Regime Map – A normalized price & volume regime map for cTrader that scores trend from –10 to +10, colors
Stochastic RSI (StochRSI) is a technical indicator used to measure the strength and weakness of the RSI.
Version 3: Full control of session display including start and end times of all 3 sessions!
Analyzes price and delta volume across periods, projecting future trends with visual tools and detailed data🚀📈
EMA dragon combination moving averages, and volume signal, ideal long trends, h4 chart,
Session Volatility Radar: adaptive volatility+structure signals with session bands, IB ranges and SignalFib
This indicator is designed to perform multiple non-linear regression analysis using four independent variables.
The Indicator is a powerful tool for price-action traders seeking to identify and exploit short-term imbalances.
institutional-level market analysis
VWAP Set to Tokyo Open
The CRT indicator helps ICT traders identify candlestick patterns, enhancing analysis of higher timeframe on lower
Sync vertical lines automatically between multiple charts of the same symbol. Mark once — see it everywhere. Ideal for m
Turn data into precision trades with AlphaTrend Pro Max — advanced trend, signal & structure analysis in one.
The KDJ oscillator display consists of 3 lines (K, D and J - hence the name of the display) and 2 levels.
Larry Williams 9.1
Advanced price levels! Rounded prices with full style settings. Suitable for all currency pairs and timeframes.
Supertrend - Multi-Timeframe Indicator
登録日 21/02/2025
461.42M
取引数量
178.3K
獲得pips
10
販売
5.76K
無料インストール