
Penerangan
SMC Ultimate Signals adalah penunjuk Smart Money Concepts untuk cTrader yang secara automatik mengenal pasti elemen struktur pasaran utama terus pada carta anda.
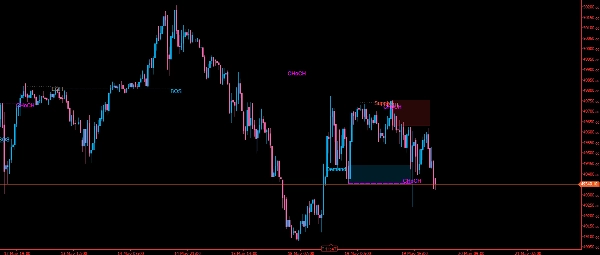
Ia mengesan Break of Structure (BOS) dan Change of Character (CHoCH) dengan menjejaki ayunan tinggi dan rendah yang disahkan — ayunan hanya sah apabila bilangan bar yang boleh dikonfigurasikan di kedua-dua sisi mengesahkan pivot tersebut. BOS atau CHoCH bullish berlaku apabila harga melepasi ayunan tinggi terakhir; bearish apabila ia melepasi ayunan rendah terakhir. Perbezaan antara BOS dan CHoCH bergantung pada keadaan trend semasa: pecahan dalam arah trend adalah BOS, pecahan bertentangan menandakan CHoCH (pembalikan trend).
Penunjuk ini juga menandakan Equal Highs (EQH) dan Equal Lows (EQL) apabila dua titik ayunan berturut-turut jatuh dalam toleransi pip yang boleh dikonfigurasikan, menunjukkan kolam kecairan.
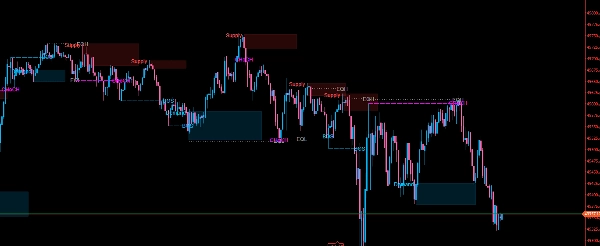
Zon Bekalan dan Permintaan secara automatik dilukis di sekitar ayunan tinggi atau rendah yang mencetuskan pecahan struktur. Anda boleh memilih untuk memaparkan hanya zon bekalan dan/atau permintaan yang paling terkini untuk mengekalkan carta yang kemas, dan secara pilihan melanjutkan semua zon ke tepi kanan carta.
Parameter utama:
- Panjang Ayunan — bar pengesahan di setiap sisi
- Toleransi EQ — jarak pip untuk pengesanan EQH/EQL
- Max Bars — hadkan pemprosesan kepada N bar terakhir untuk prestasi
- Ketelusan & Sambungan Zon — laraskan penampilan visual
- Togol BOS, CHoCH, EQH/EQL, zon, dan penanda ayunan secara bebas