
Fixed Range Volume Profile_V1.0.0
Indicatore
845 download
Versione 1.0, May 2026
Windows, Mac
5.0
Recensioni: 3

Da 14/05/2026
161.59K
Volume negoziato
142.43K
Profitto in pip
845
Installazioni gratuite
Descrizione
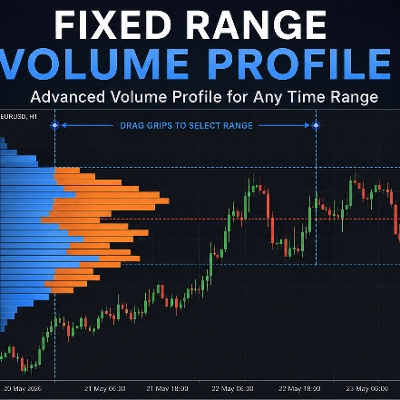
Questo indicatore consente ai trader di analizzare la distribuzione del volume su qualsiasi intervallo personalizzato selezionato direttamente sul grafico utilizzando maniglie di trascinamento interattive, simili agli strumenti a intervallo fisso in stile TradingView professionale.
Caratteristiche principali
- Maniglie di trascinamento interattive per una rapida selezione dell'intervallo
- Rilevamento POC (Punto di Controllo)
- VAH & VAL (Valore Area Alta / Bassa)
- Separazione del volume in aumento e in diminuzione
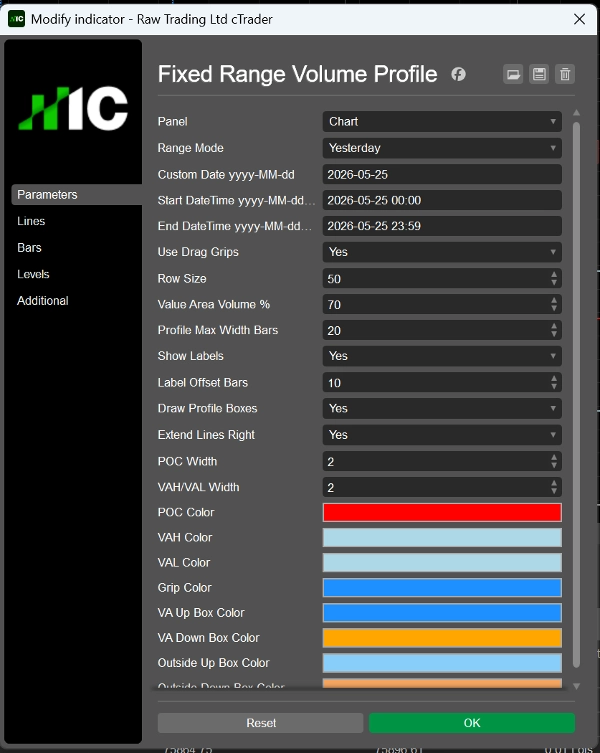
- Colori e stili completamente personalizzabili
- Estensione dei livelli chiave sul lato destro del grafico
- Modalità intervallo data personalizzata e data/ora personalizzata
- Ottimizzato per il trading manuale e l'analisi della struttura di mercato
- Rendering del grafico pulito e leggero
- Funziona direttamente con i dati del grafico (non è necessaria una fonte dati esterna)
Perfetto per
- Trader di profilo volume
- Trading basato sull'azione del prezzo
- Analisi di supporto e resistenza
- Rilevamento delle zone di liquidità
- Trading intraday e swing
- BTC, Forex, Oro, Indici e CFD
Elementi visivi inclusi
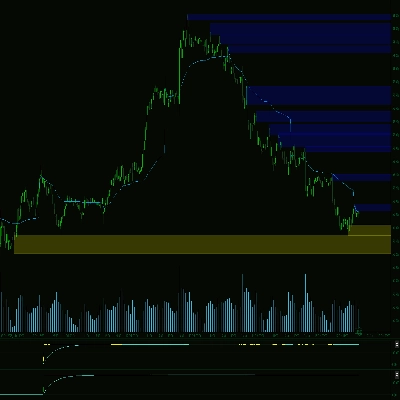
- Box istogramma del volume
- Linea POC
- Linea VAH
- Linea VAL
- Etichette sul lato destro
- Maniglie di intervallo interattive
Progettato per trader che necessitano di un profilo volume a intervallo fisso pulito, veloce e altamente configurabile all'interno di cTrader.
Riepilogo
AI summary
Fixed Range Volume Profile is a volume analysis indicator designed for use within cTrader. It enables traders to examine volume distribution over any user-defined price and time range directly on the chart through interactive drag handles. Key features include detection of Point of Control (POC), Value Area High (VAH), and Value Area Low (VAL), as well as separation of up-volume and down-volume. The indicator offers customizable colors and styles, and key volume levels can be extended to the right side of the chart for ongoing reference. Users can select custom date or datetime ranges for analysis. Visual elements include volume histogram boxes, POC, VAH, and VAL lines, right-side labels, and interactive range grips. The tool is optimized for manual trading and market structure analysis, supporting markets such as BTC, Forex, Gold, Indices, and CFDs. It operates directly on chart data without requiring external data sources, providing a clean and lightweight chart rendering experience. This indicator is suited for volume profile traders, price action trading, support and resistance analysis, liquidity zone detection, and both intraday and swing trading styles.
Profilo indicatore
Categoria indicatore
Volume
Tipo di output
Visualizzazione
Requisiti per i dati
Volume
Recensioni dei clienti
5.0
Recensioni: 3
5 | 100 % | |
4 | 0 % | |
3 | 0 % | |
2 | 0 % | |
1 | 0 % |
Recensioni dei clienti
July 19, 2026
Fixed Range Volume Profile is a highly anticipated, TradingView-style tool for cTrader. It features smooth interactive drag grips to select any chart range, instantly calculating POC, VAH, and VAL. The developer smartly handles missing broker history with clear UI warnings instead of crashing. While dragging grips on mobile is tricky, the desktop experience is excellent. It’s a must-have for traders mapping liquidity and structural volume zones directly on their charts.
June 8, 2026
It is a great indicator that work for me ! I was seeking such a that indicator and finally I found it .Thanks !
Discussioni
Domande frequenti
Volume
I prodotti disponibili tramite cTrader Store, inclusi bot di trading, indicatori e plugin, sono forniti da sviluppatori terzi e resi disponibili esclusivamente a scopo informativo e di accesso tecnico. cTrader Store non è un broker e non fornisce consulenze in materia di investimento, raccomandazioni individualizzate o garanzie di risultati futuri.















Prezzo
Da 14/05/2026
161.59K
Volume negoziato
142.43K
Profitto in pip
845
Installazioni gratuite