present
Zarejestruj się i otrzymaj 50 $ zniżki na pierwszy zakup
Trading product for DRXFootprint Wskaźnik Aggressive BOS, image 1
DRXFootprint
Wskaźnik
1 zakupy
Wersja 1.0, Jul 2026
Windows, Mac
Trading product for DRXFootprint Wskaźnik Aggressive BOS, image 2
Trading product for DRXFootprint Wskaźnik Aggressive BOS, image 3
Trading product for DRXFootprint Wskaźnik Aggressive BOS, image 4
Od 08/07/2026

Opis

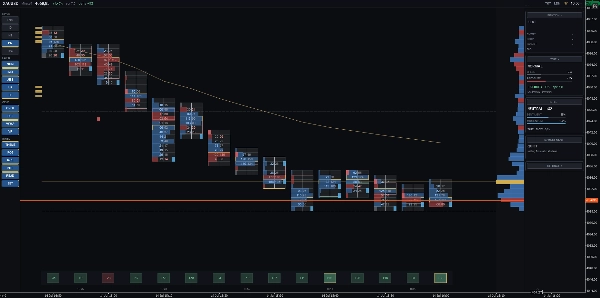
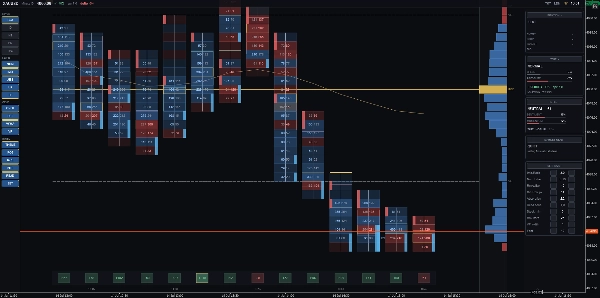
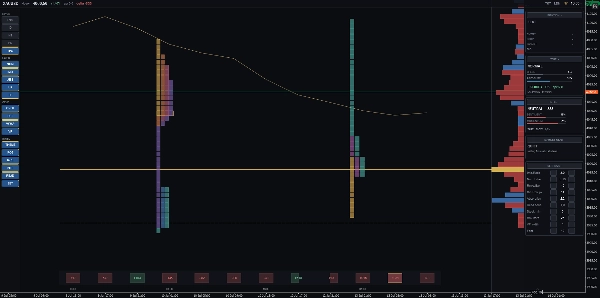
DRX OrderFlux przekształca dane tick w czysty wykres przepływu zleceń, pokazując, gdzie momentum ustaje i które poziomy aukcji są wielokrotnie testowane. CO RYSUJE - Ślad Bid x Ask: Podzielony na poziomy cenowe z aktywnością kupna i sprzedaży obok siebie. Pięć widoków: Bid x Ask, Delta, Heatmapa, Profil i TPO. - Nierównowagi i nałożone ściany: Podkreśla poziomy cen, gdzie nierównowaga wolumenu przekracza wybrany przez Ciebie współczynnik. - Absorpcja i nieukończone aukcje: Wykrywa wysoką aktywność, która nie przesuwa ceny dalej, oraz ekstremalne poziomy zamykające niekompletne transakcje. - Pojedyncze wydruki: Podkreśla poziomy cen odwiedzane krótko przed szybkim odrzuceniem. - Profil wolumenu: Wyświetlany w panelu przypiętym do prawej krawędzi z POC, VAH, VAL i sesyjnym VWAP. - Bloki czasowe TPO: Jeden profil na sesję z dedykowanym POC, kodowany kolorystycznie chronologicznie. - Pasmo delty: Umieszczone na dole w jednej linii dla bezpośredniego porównania. - Odczyt rynku: Dyskretne sygnały pojawiające się podczas wyraźnych odrzuceń lub wybicia wolumenu. Progi kalibrują się automatycznie dla każdego symbolu. - Panel taśmy: Mierzy aktualną prędkość taśmy względem średnich poziomów i dostarcza ostrzeżenia o płynności. - Panel pozycji: Wyświetla wejście, stop, cel, PnL oraz stosunek ryzyka do zysku z wyraźnymi liniami na wykresie. Ustawienia układu są zapisywane automatycznie dla każdego symbolu i interwału czasowego. JAK UŻYWAĆ Kompatybilny ze wszystkimi symbolami i interwałami czasowymi. Idealny do analizy intraday (M1 do H1). Działa razem z DRX Footprint Lower dla dedykowanych paneli wolumenu, delty i skumulowanej delty. O DANYCH Dane tick cTrader zawierają czas, oferty bid i ask, ale nie przesyłają danych o wielkości transakcji. DRX OrderFlux mierzy aktywność ticków, a nie wolumen kontraktów, stosując standardową metodologię wolumenu ticków FX. Dane Depth of Market opierają się na źródłach brokera. Większość kont CFD oferuje ograniczone poziomy zagregowane; dlatego ostrzeżenia o płynności są zintegrowane z panelem taśmy, a nie z drabiną księgi zleceń.

Podsumowanie

AI summary
DRXFootprint is an order flow indicator designed for use on any symbol and timeframe, with optimal performance on intraday charts (M1 to H1) for instruments like gold, indices, oil, and major forex pairs. It transforms tick data into a detailed order flow chart, displaying bid and ask activity side by side at each price level within bars, effectively breaking down each bar into its constituent buy and sell actions.

Key features include five distinct views: Bid x Ask footprint, Delta, Heatmap, Volume Profile, and TPO (Time Price Opportunity). The indicator highlights imbalances and stacked walls where one side dominates, absorption zones where heavy activity fails to move price, unfinished auctions, and single prints—levels touched only once. The volume profile panel shows POC (Point of Control), VAH (Value Area High), VAL (Value Area Low), and session VWAP. TPO profiles per session are color-coded to compare auction shapes across days.

Additional tools include a delta lane for comparing bars, a market read panel that signals price rejections or breaks with volume and delta confirmation, a tape panel showing tape speed and liquidity warnings, and a position panel displaying entry, stop, target, PnL, pips, and risk-reward ratio. Layouts are saved per symbol and timeframe for consistent workspace setup.

DRXFootprint uses cTrader tick data, measuring tick activity rather than traded contract volume, and includes liquidity warnings based on broker depth of market data.
Profil wskaźnika

Opinie klientów

0.0
Opinie: 0
Opinie klientów
Ten produkt nie ma jeszcze opinii. Wypróbowałeś(-aś) go już? Bądź pierwszy(-a) i powiedz o tym innym!

Dyskusja

Częste pytania

Aggressive
BOS
Imbalance
Order Block
Volume
CHOCH
DOM Tools
Produkty dostępne za pośrednictwem cTrader Store, w tym boty handlowe, wskaźniki i wtyczki, dostarczane są przez deweloperów zewnętrznych i udostępniane wyłącznie w celach informacyjnych oraz w celu zapewnienia dostępu technicznego. cTrader Store nie jest brokerem i nie zapewnia doradztwa inwestycyjnego, nie udziela spersonalizowanych rekomendacji ani nie gwarantuje przyszłych wyników.

Możesz także polubić

Wskaźnik
AI
RSI
+7
EMA MTF TREND PRO - Multi-timeframe trend analysis overlay indicator, 6 timeframes - in one table with ADX
Wskaźnik
ADX
ATR
+3
Nine live gauges turn raw market data into one clear dashboard. Trend, volume, volatility - at a glance, any symbol.
Wskaźnik
VWAP
Forex
+5
Dynamic Swing Anchored VWAP
Wskaźnik
Signal
🔹 Trend-Reversal-Indicator for cTrader 🔹 The ultimate Renko chart tool!
Wskaźnik
ATR
RSI
+5
One of the best indicators we have ever developed, with a very high profit ratio.
Wskaźnik
Forex
Indices
+1
Detects HTF bias using CRT, Expansion & Swing Point patterns with SMT/PSP divergence — visualised in a floating candle
Logo „Prometheus”
Najwyżej oceniane
4.0
(4)
Wskaźnik
AI
ATR
+15
AI-powered Smart indicator. Dual neural networks self-train on live trades. Liquidity sweep + SMC. All pairs/timeframe.
Wskaźnik
Order Block
Fair Value Gap
+1
This indicator contains most of the ICT strategies that you need. You can turn on/off each one to be shown.
Wskaźnik
Pin Bar
Order Block
+5
Sierra Chart's Flex Renko Inverse, rebuilt for cTrader. Trends stay on one brick. Reversals print only when real.
Wskaźnik
SMC
Breakout
+1
Delta Peak Bubbles is a tick‑chart overlay for cTrader that highlights the strongest momentum spikes.
Wskaźnik
Forex
BTCUSD
+5
Daily/Weekly/Monthly - Highs & Lows Indicator (Customizable Settings)
Wskaźnik
MSS
Volume
+3
Rejection-based volume profile with tiered heat zones, POC levels and a fully draggable anchor on cTrader.
Wskaźnik
ATR
EMA
+5
Multi-factor volatility squeeze detector, dual-trend scoring & breakout validation dashboard. No repaint.
Wskaźnik
AI
RSI
+7
Multi-asset screener with real-time RSI/volatility analysis, interactive dashboard, and color-coded trading signals.
Wskaźnik
Doji
Wedge
+5
Angora Pattern Recognition is a cTrader indicator that finds, draws and tracks classic chart patterns automatically.
Wskaźnik
Key Levels
Supertrend
+1
A cTrader indicator for clear trend direction, entry timing, and on-chart risk visualization.
Wskaźnik
Grid
Forex
+5
Square Matrix Trading System by LudwigICT – Institutional-Grade Trading Clarity in cTrader
Wskaźnik
BOS
Fibonacci
+4
Market structure, liquidity sweeps, BOS/CHoCH, smart zones and BUY/SELL setups with Entry, SL and TP.

Cena

Od 08/07/2026