

present
ลงทะเบียนและรับส่วนลด $50 สำหรับการซื้อครั้งแรกของคุณ
Trading product for Rigid Volume Profile อินดิเคเตอร์ Key Levels Volume, image 1
Rigid Volume Profile
อินดิเคเตอร์
เวอร์ชัน 1.0, Sep 2026
Windows, Mac
Trading product for Rigid Volume Profile อินดิเคเตอร์ Key Levels Volume, image 2
Trading product for Rigid Volume Profile อินดิเคเตอร์ Key Levels Volume, image 3
Trading product for Rigid Volume Profile อินดิเคเตอร์ Key Levels Volume, image 4
Trading product for Rigid Volume Profile อินดิเคเตอร์ Key Levels Volume, image 5
Trading product for Rigid Volume Profile อินดิเคเตอร์ Key Levels Volume, image 6
Trading product for Rigid Volume Profile อินดิเคเตอร์ Key Levels Volume, image 7
Trading product for Rigid Volume Profile อินดิเคเตอร์ Key Levels Volume, image 8
Trading product for Rigid Volume Profile อินดิเคเตอร์ Key Levels Volume, image 9
Trading product for Rigid Volume Profile อินดิเคเตอร์ Key Levels Volume, image 10
Trading product for Rigid Volume Profile อินดิเคเตอร์ Key Levels Volume, image 11

คำอธิบาย

Rigid Volume Profile slices your lookback window into a fixed number of price levels and shows how much volume traded at each one, split into buying and selling pressure.


WHAT IT DRAWS


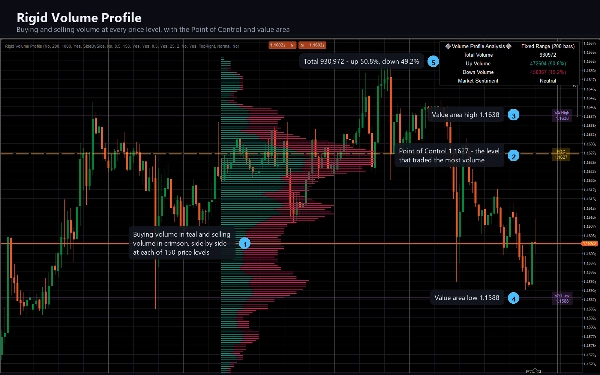
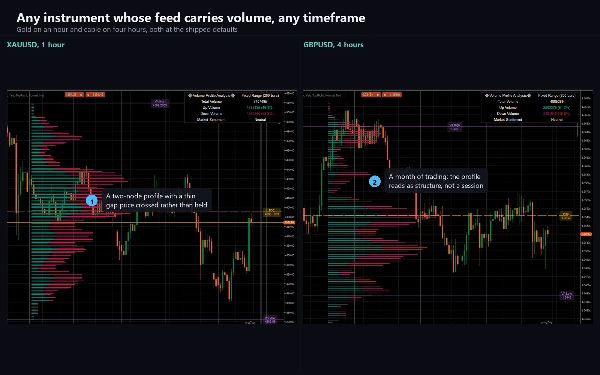
A horizontal histogram beside the price action, built from the last N bars. Each level's bar is split into bullish volume (from bars that closed up) and bearish volume (from bars that closed down), so you can see not just where trading happened but which side was doing it. Bars that closed unchanged split their volume evenly between the two.


A dashed Point of Control line marks the price level that traded the most volume in the window, labelled with its exact price.


Two value-area lines bound the levels that account for 70% of the window's volume, each labelled.


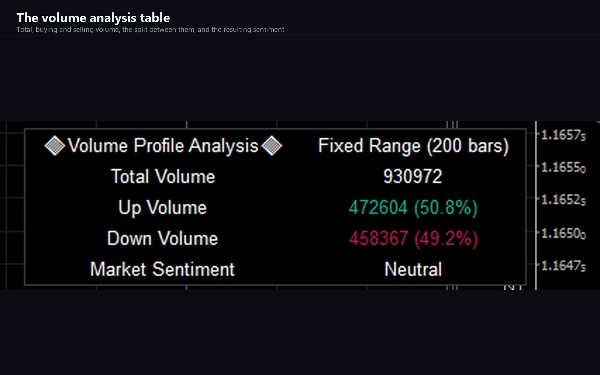
A volume analysis table reports total, up and down volume with percentages, and a sentiment reading based on which side dominates.


HOW TO USE IT


Volume profiles describe where trading actually happened, rather than where price merely travelled. A level that absorbed a lot of volume is a level many participants care about; a thin part of the profile is a price range the market moved through quickly.


Read the Point of Control as the window's centre of gravity. Read the value area as the range where most of the business was done. Read a thin gap between two heavy nodes as a zone price tends to cross rather than linger in. Watch which side of the split dominates a level when price returns to it.


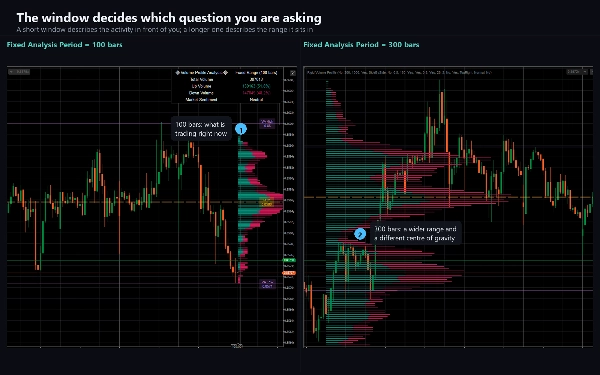
The window is yours to choose and the picture changes with it, so pick a lookback that matches the decision you are making. A 100-bar profile answers a different question from a 500-bar one.


KEY SETTINGS


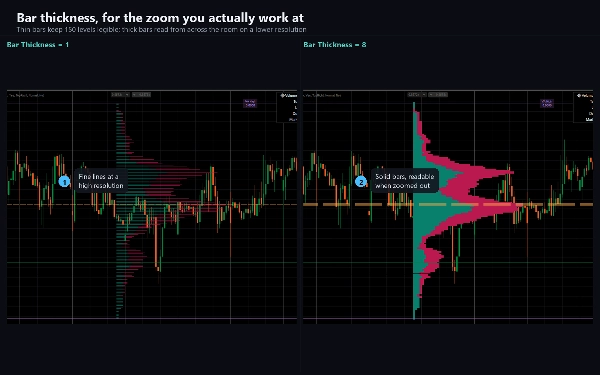
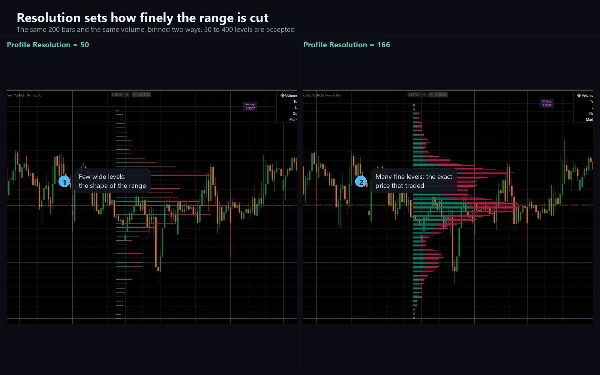
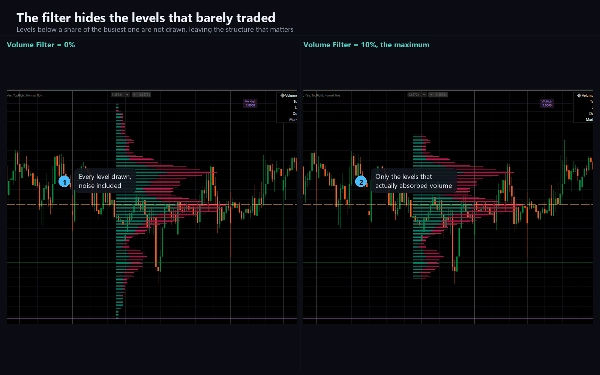
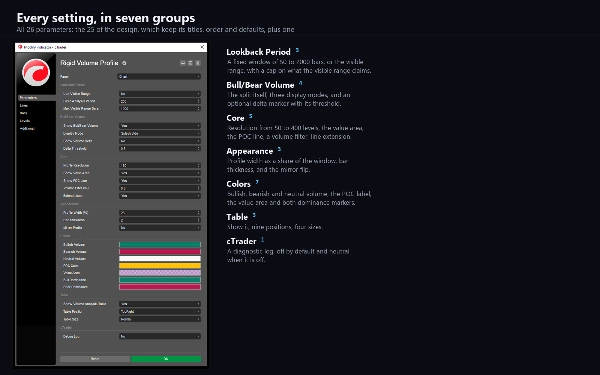
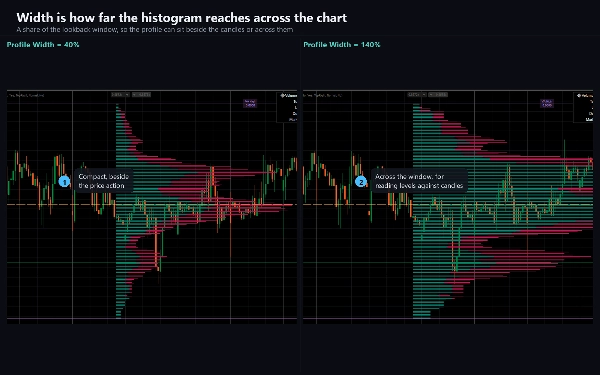
Fixed Analysis Period sets the lookback in bars, 50 to 2000. Profile Resolution sets how many price levels the range is divided into, 50 to 400; fewer levels read like a classic profile, more give fine detail. Display Mode offers Side by Side, Stacked and Split. Profile Width scales the histogram as a percentage of the lookback. Volume Filter hides levels below a percentage of the busiest one. Show Volume Delta adds a marker where one side clearly dominates. Every colour is adjustable, and the analysis table can be moved to any of nine positions or turned off.


Use Visible Range switches the lookback to the bars currently on screen instead of a fixed count.


INDICATOR TYPE AND WINDOW


Chart overlay. It draws on the price chart itself, not in a separate pane.


TIMEFRAMES AND INSTRUMENTS


Any timeframe. It is most useful intraday, from M5 to H4, where a session's volume distribution is a meaningful object.


Works on any instrument whose feed carries volume. On forex that is tick volume, the number of price updates per bar, which is a proxy for activity rather than traded size. On index and commodity CFDs some brokers supply real exchange volume, and the profile is more meaningful there. On an instrument with no volume at all, nothing is drawn.


WHO IT IS FOR


Traders who already work with volume profiles and want one with an adjustable fixed grid and an explicit buying and selling split, rather than a fixed session profile.


TRIAL


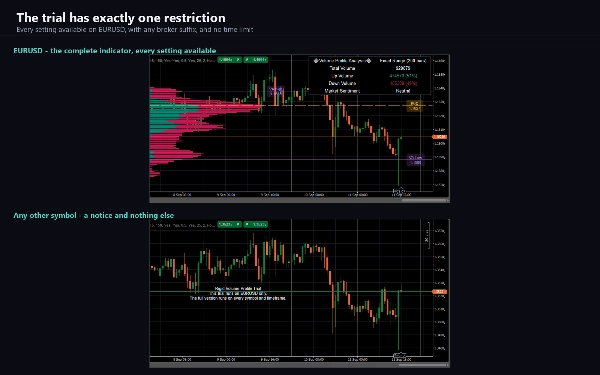
A trial edition is attached to this product. It is the complete indicator with every setting available, restricted to EURUSD. The full version removes that restriction and adds nothing else.


TECHNICAL NOTES AND LIMITATIONS


The profile is recalculated on every tick of the forming bar, so the Point of Control and the value area move within a bar and settle when it closes. This is by design. Nothing here is a closed-bar signal.


At Profile Resolution above 166 the lowest price levels are not drawn. This is a deliberate limit of the design, which reserves a fixed pool of drawing objects and uses three per price level; the Show POC Line and Show Value Area toggles each free one. Keep Profile Resolution at 166 or below to see the full profile.


The value area is built by ranking levels by volume and taking them in that order until 70% is reached, then reporting the highest and lowest price among them. It is therefore usually wider than a value area built by walking outward from the Point of Control.


Because the profile is built from your broker's volume, two brokers will not produce an identical profile from the same market.


AccessRights is None: the indicator places no orders, modifies nothing, and reads no account data.


SUPPORT


Documentation covering every parameter, the settings that surprise people, and a troubleshooting guide ships with the product. Questions are welcome through the Discussion tab; a useful report names the symbol, broker, timeframe, cTrader version and the settings changed from default.


Trading involves risk. Past performance does not guarantee future results.

สรุป

โปรไฟล์อินดิเคเตอร์
หมวดหมู่อินดิเคเตอร์
ปริมาณ
ประเภทเอาต์พุต
การแสดงเป็นภาพ
ข้อกำหนดด้านข้อมูล
แท่งเท่านั้น
ปริมาณ
สัญญาณที่รองรับ
แตะ Level ที่ระบุ
เบรก Level ที่ระบุ

รีวิวจากลูกค้า

0.0
รีวิว: 0
รีวิวจากลูกค้า
ยังไม่มีรีวิวสำหรับผลิตภัณฑ์นี้ หากเคยลองแล้ว ขอเชิญมาเป็นคนแรกที่บอกคนอื่น!

การสนทนา

คำถามที่พบบ่อย

Key Levels
Volume
Support & Resistance
ผลิตภัณฑ์ที่มีให้บริการผ่าน cTrader Store รวมถึงบอทการเทรด อินดิเคเตอร์ และปลั๊กอิน มีให้บริการโดยนักพัฒนาบุคคลที่สามและมีไว้เพื่อวัตถุประสงค์ในการเข้าถึงข้อมูลและทางเทคนิคเท่านั้น cTrader Store ไม่ใช่โบรกเกอร์และไม่ได้ให้คำแนะนำการลงทุน คำแนะนำส่วนบุคคล หรือการรับประกันผลการดำเนินงานในอนาคต

เพิ่มเติมจากผู้เขียนคนนี้

อินดิเคเตอร์
ATR
BOS
+5
Know how strong each Supertrend flip is: scored BUY/SELL, structure stop + 3 targets, live win-rate dashboard, alerts.
อินดิเคเตอร์
ADX
ATR
+5
Scored breakouts of sloped pivot trendlines: four filters on the break bar, ATR stop, 1:1 / 1:2 / 1:3 targets, alerts.
อินดิเคเตอร์
ATR
RSI
+5
Supply and demand zones with break of structure, higher timeframe MA signals, a percent stop and three targets.
อินดิเคเตอร์
ATR
Volume
+3
Fibonacci trend signals on closed bars, with an ATR stop, up to four targets and a break-even ladder.
อินดิเคเตอร์
ADX
ATR
+5
Ten confluence layers scored on every closed bar, with an anti-chop gate, pivot levels and a live dashboard.
อินดิเคเตอร์
Volume
Channel
+3
A higher-timeframe log-regression channel with a volume profile, Point of Control and session levels.
อินดิเคเตอร์
ADX
ATR
+5
SuperTrend signals scored on five confluence factors, with an ATR stop, three targets and a dashboard.

นอกจากนี้คุณยังอาจชอบ

"Candlestick Patterns - Special Candles" โลโก้
เรตติ้งสูง
4.5
(4)
$19
/
$35
อินดิเคเตอร์
Boost your trading with Candlestick Patterns for cTrader – auto-detect key signals for smarter, faster decisions!
อินดิเคเตอร์
RSI
Breakout
+1
🚀 TrendHeikinMultiMA: Advanced trend detection using Heikin-Ashi smoothing & MAs! Eliminates noise, confirms real trend
อินดิเคเตอร์
ADX
ATR
+5
Designed exclusively for trading the Gold market (XAUUSD), GoldMasterIndicator provides institutional-grade technical!
"Smooth Heiken Ashi" โลโก้
ยอดนิยม
4.6
(3)
$19
อินดิเคเตอร์
Prop
Forex
+4
The Smooth Heiken Ashi indicator is a refined charting tool designed to filter out market noise and highlight true price
อินดิเคเตอร์
ATR
Forex
+7
Final Moving Average is an adaptive system designed to keep traders aligned with the true direction of the market
อินดิเคเตอร์
ATR
Forex
+11
Elliott Wave 2 indicator with Markov probability analysis and a confidence score to assess Wave 3 continuation quality.
อินดิเคเตอร์
SMC
Forex
+15
Session-based range tool projecting adaptive Gann & Fib levels with auto bias flip and extensions.
"CandleColourFlow_MultiFx" โลโก้
เรตติ้งสูง
4.4
(5)
$19
อินดิเคเตอร์
CandleColourFlow MultiFx - optimized to work on Fx Majors, Fx MInors, Fx Crosses
"SSL Channel" โลโก้
ยอดนิยม
4.5
(4)
$19
/
$20
อินดิเคเตอร์
Forex
BTCUSD
+10
Trend-following channel using dual MAs with visual cloud and optional alerts on crossovers
อินดิเคเตอร์
Order Block
Fair Value Gap
+1
This indicator contains most of the ICT strategies that you need. You can turn on/off each one to be shown.
อินดิเคเตอร์
Volume
Fibonacci
+3
Draw and manage multiple fixed-range volume profiles with persistent levels, developing POC/VA and smart alerts.
อินดิเคเตอร์
Shows BUY & SELL signals for 3 & 4 BAR PATTERN (Morning star/ Evening star). It is adjustable and it will SHOW ARROWS.
อินดิเคเตอร์
ATR
EMA
+4
SCALPING M1 CTRADER v1.0 — Institutional-Grade M1 Gold & Forex Scalping System
"Supertrend Indicator v1.1" โลโก้
ยอดนิยม
4.5
(4)
$19
/
$30
อินดิเคเตอร์
AI
ATR
+27
Supertrend Indicator
"ICT Killzones & Macros" โลโก้
เรตติ้งสูง
4.7
(4)
$20
/
$30
อินดิเคเตอร์
SMC
Prop
+8
KILLZONES AND MACRO SESSIONS
"ZigZag Structure Pro" โลโก้
เรตติ้งสูง
4.2
(4)
$19
/
$20
อินดิเคเตอร์
Forex
BTCUSD
+12
🎯Automatically identifies the market's significant turning points (key H & L) and draws dynamic support and.....✍️
อินดิเคเตอร์
EMA
RSI
+5
Keep your focus with smart on-chart notes. Features Markdown, 6 themes, and auto-save per symbol for manual trading.When
"MACARX 2026 ULTRA" โลโก้
เรตติ้งสูง
4.2
(5)
$20
/
$25
อินดิเคเตอร์
ATR
RSI
+9
🚀 MACARX Indicator - The Multi-Indicator Trend Fusion 🚀

ราคา




























