
คำอธิบาย
📌 คำอธิบายสำหรับ Store cTrader – ภาษาฝรั่งเศส 🇫🇷
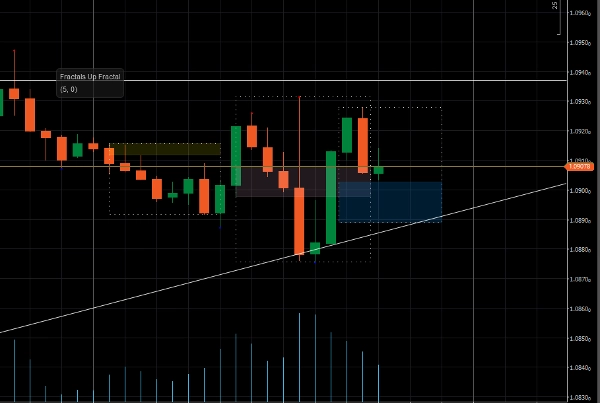
🔍 ตัวบ่งชี้ [LDE] OPR & Market Sessions – การแสดงผลเซสชันที่ชัดเจน!
ตัวบ่งชี้นี้เน้นไปที่ เซสชันหลักของตลาด (โตเกียว, ลอนดอน, นิวยอร์ก) โดยแสดง สี่เหลี่ยมผืนผ้าสำหรับเคลื่อนไหว บนกราฟของคุณ
✔ การแสดงผลเซสชันที่ปรับแต่งได้ 🏙️
✔ การแสดงระดับสูง/ต่ำตามเซสชัน 📈
✔ การเน้นช่วงราคาเปิด (OPR) ⏳
✔ ความโปร่งใสที่ปรับได้เพื่อการอ่านที่ดีขึ้น 🎨
✔ เข้ากันได้กับสินทรัพย์และช่วงเวลาทั้งหมด ⏰
🔧 การตั้งค่าที่ยืดหยุ่น : เปิด/ปิดแต่ละเซสชัน ปรับสี และปรับแต่งการแสดงผลระดับสูง/ต่ำสำหรับแต่ละเซสชัน
🚀 เพิ่มประสิทธิภาพการเทรดของคุณโดยการระบุโซนตลาดสำคัญได้อย่างรวดเร็ว!
📌 Description for cTrader Store – English 🇬🇧
🔍 [LDE] OPR & Market Sessions Indicator – Clear visualization of sessions!
This indicator highlights major market sessions (Tokyo, London, New York) by displaying dynamic rectangles on your chart.
✔ Customizable session display 🏙️
✔ Session-specific High/Low visualization 📈
✔ Highlighting of the Open Price Range (OPR) ⏳
✔ Adjustable transparency for better readability 🎨
✔ Compatible with all assets and timeframes ⏰
🔧 Flexible settings: enable/disable each session, adjust colors, and personalize the High/Low display for each session.
🚀 Optimize your trading by identifying key market zones at a glance!
สรุป
รีวิวจากลูกค้า
5 | 0 % | |
4 | 100 % | |
3 | 0 % | |
2 | 0 % | |
1 | 0 % |


