Description
Introduction
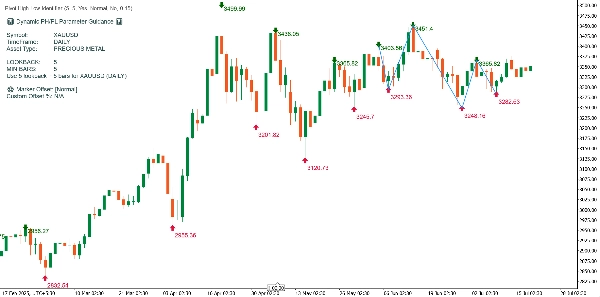
Le graphique affiché utilise l'indicateur personnalisé "Improved PH/PL Visualization" de cTrader. Cet outil identifie dynamiquement les points hauts et bas pivotants (PH/PL) essentiels, trace des lignes de tendance en zigzag entre eux, et génère un panneau d'orientation informatif basé sur le symbole, la période et le type d'actif détecté. Ci-dessous se trouve une explication détaillée de la manière dont l'indicateur traite et annote le graphique d'exemple.
Éléments clés illustrés sur le graphique
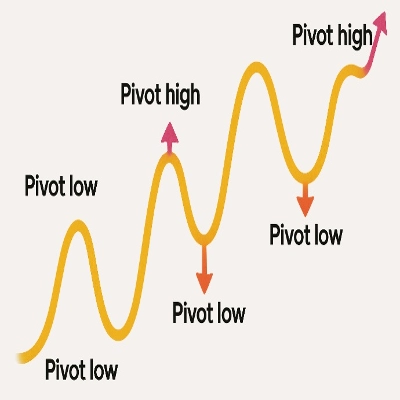
1. Points hauts pivotants (PH) et points bas pivotants (PL)
- Points hauts pivotants : Marqués par des flèches vertes vers le bas et leurs prix hauts respectifs au-dessus des barres.
- Points bas pivotants : Marqués par des flèches rouges vers le haut et leurs prix bas respectifs sous les barres.
- Logique utilisée : Un PH se produit lorsqu'un plus haut d'une barre est supérieur aux plus hauts des 'lookback' barres avant et après ; un PL est défini de manière similaire pour les plus bas.
- Configuration du lookback : Dans votre code et graphique, un lookback de 5 est utilisé, offrant une détection robuste des oscillations adaptée aux données quotidiennes.
2. Étiquettes de prix
- Affichage activable : Les étiquettes de prix attachées à chaque marqueur PH/PL peuvent être affichées ou masquées via les paramètres de l'indicateur. Dans cet exemple, les prix sont affichés pour plus de clarté.
- Ajustement automatique du décalage : Le positionnement des étiquettes est décalé algorithmiquement en utilisant l'espacement optimal (préréglé ou personnalisé), garantissant que le texte ne chevauche pas les chandeliers ou éléments du graphique.
3. Lignes de tendance en zigzag dynamiques
- Visualisation : Des lignes en zigzag bleues relient les points PH/PL les plus récents et significatifs, mettant en évidence la séquence des oscillations majeures des prix.
- Objectif : Cela aide les traders à suivre visuellement les changements de tendance et les variations de momentum sur la période du graphique.
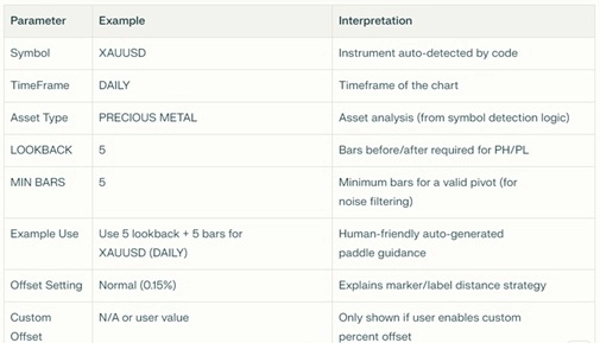
4. Panneau d'orientation dynamique
Le panneau en haut à gauche du graphique résume les paramètres clés, les résultats de détection et les recommandations d'utilisation
Comment l'indicateur fonctionne sur ce graphique
Explication étape par étape :
- Identification des oscillations :
L'indicateur analyse chaque barre quotidienne après initialisation, comparant les plus hauts et les plus bas sur une fenêtre de cinq barres de chaque côté pour identifier les PH et PL. - Placement des marqueurs :
Les PH et PL sont marqués à l'aide de flèches colorées ; leurs étiquettes de prix correspondantes sont positionnées à une distance optimale pour assurer la clarté. - Visualisation de la tendance :
L'algorithme sélectionne les 10 pivots les plus récents (PH/PL, configurable) et trace des lignes bleues les reliant, cartographiant les oscillations majeures du marché et aidant à la reconnaissance des tendances. - Panneau des paramètres :
Le panneau d'affichage confirme la détection automatique du type d'actif (ici : XAUUSD, un "MÉTAL PRÉCIEUX") et fournit aux utilisateurs des valeurs recommandées optimales pour le lookback, le nombre minimum de barres et le décalage pour cette combinaison — toutes visibles brièvement. - Adaptation intelligente à l'actif :
Si vous appliquez cet indicateur à un autre symbole (comme un forex exotique, une crypto ou un indice boursier), le panneau d'orientation et la logique de détection s'ajustent automatiquement, définissant le lookback recommandé et le nombre minimum de barres pour ce comportement de marché spécifique et cette période. - Expérience graphique épurée :
Tous les objets graphiques dessinés (flèches, lignes de tendance, étiquettes de prix, texte statique) sont nettoyés et redessinés à chaque calcul pour éviter l'encombrement. L'indicateur superpose toujours ses informations sur le graphique des prix, jamais dans un panneau séparé.
Points pratiques à retenir pour le trading
- Reconnaissance de la structure des oscillations : Vous pouvez rapidement lire la séquence et l'amplitude des oscillations du marché.
- Planification des entrées/sorties : Les retournements PH/PL peuvent être utilisés pour la logique de stop suiveur ou pour anticiper des points de retournement potentiels.
- Utilisation universelle : Quel que soit l'actif ou la période, l'indicateur s'auto-ajuste et explique ses recommandations.
- Visuels clairs et professionnels : L'encombrement des prix et le chevauchement des étiquettes sont minimisés grâce à un décalage intelligent.
Résumé
Ce graphique démontre la puissance et la clarté de l'Improved PH/PL Visualization. L'indicateur fournit au trader des indices visuels immédiats sur les points pivots majeurs, la direction et la taille des oscillations, ainsi qu'une orientation contextuelle spécifique à l'instrument et à la période. Tout est automatisé, à jour et personnalisable pour tout actif ou environnement de marché.
Note : En raison des limitations de cTrader, l'indicateur propose l'option de placer l'indicateur dans un nouveau panneau, mais cela ne sera pas applicable car l'indicateur ne peut pas être affiché dans un nouveau panneau en raison de sa taille et de son fonctionnement. De plus, si les prix sont affichés trop loin des flèches pivotantes et que cela devient confus pour l'utilisateur, celui-ci peut choisir manuellement d'afficher ou non les prix.
Si vous avez besoin d'une personnalisation supplémentaire, comme des signaux sonores/alertes aux pivots, ou un filtrage dynamique pour les oscillations plus petites, n'hésitez pas à demander !


