
Candle Timer & Strength Demo
Gösterge
266 i̇ndirmeler
Sürüm 1.0, Jul 2025
Windows, Mac
Açıklama
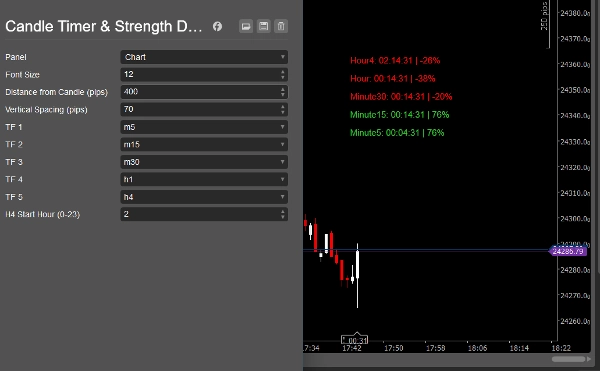
Ana Özellikler:
- Çoklu Zaman Dilimi Mum Sayıcıları:
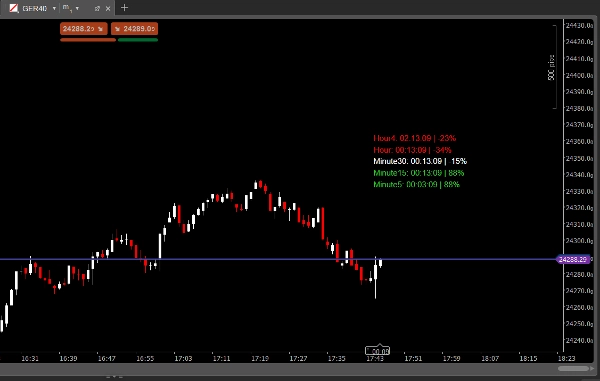
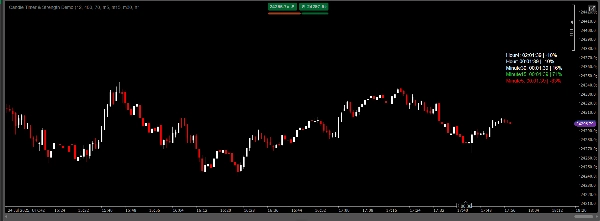
Seçilen 5 zaman dilimine kadar bir sonraki mum kapanışına geri sayımı tek bir net panelde görün. - Mum Gücü % Olarak:
Kapanışın mumun aralığına göre konumuna dayanarak, her zaman dilimi için mevcut mumun gücünü (-%100 ila +%100 arasında) anında görüntüleyin. - Özelleştirilebilir Panel:
-
- Yazı tipi boyutunu, son mumdan mesafeyi ve dikey aralığı ayarlayın.
- Tercih ettiğiniz zaman dilimlerini seçin (M1, M5, M15, M30, H1, H4, vb.).
- Renkler otomatik olarak değişir: güçlü boğa için yeşil, güçlü ayı için kırmızı, nötr için beyaz.
- Her Zaman Görünür:
Panel her zaman grafiğinizde görünür, böylece piyasa zamanlamasını ve momentumu kolayca gözlemleyebilirsiniz. - Mükemmel için:
-
- Kesin mum zamanlamasına ihtiyaç duyan scalperlar ve günlük işlemciler.
- Momentumu ve zamanlamayı tek bir yerde görmek isteyen çoklu zaman dilimi tüccarları.
- Giriş/çıkış zamanlamasını ve mum okuma becerilerini geliştirmek isteyen herkes.
Nasıl çalışır:
- Gösterge, seçilen her zaman dilimi için mevcut mumun kapanışına kalan zamanı hesaplar.
- Ayrıca mumun gücünü yüzde olarak hesaplar:
-
- +100% = mumun en üstünde kapanış (güçlü boğa)
- -100% = en altta kapanış (güçlü ayı)
- 0% = ortada kapanış (nötr)
- Panel gerçek zamanlı olarak güncellenir ve tamamen özelleştirilebilir.
Parametreler:
- Yazı Tipi Boyutu
- Mumdan Mesafe (pip)
- Dikey Aralık (pip)
- Zaman Dilimi 1–5 (özelleştirilebilir)
- H4 Başlangıç Saati (standart dışı H4 mumları olan brokerlar için)
Neden Candle Timer & Strength seçmelisiniz?
- Zaman kazanın: Zaman dilimleri arasında geçiş yapmaya veya mum kapanışlarını kafanızda hesaplamaya son.
- Güvenle işlem yapın: Piyasanın momentumu kazanıp kaybettiğini anında görün.
- Profesyonel görünüm: Temiz, modern panel her grafik stiline uyum sağlar.
- Kullanımı kolay: Tak ve çalıştır, kodlama gerekmez.
Not:
Bu demo yalnızca değerlendirme amaçlıdır.
Göstergeyi beğendiyseniz, sınırsız kullanım için tam sürümü satın alınız.
Tam sürümü almak için cTrader Mağazasında "Candle Timer & Strength" araması yapın.
Tüm göstergelerimi ve botlarımı görün:
https://ctrader.com/pl?search=kobud.222&u=kobud.222
http://www.youtube.com/@Robi22-22
📩 Sorular? Öneriler? İndirim?
Profilimde iletişim: Robikobud
Özet
YZ özeti
Candle Timer & Strength Demo for cTrader is an indicator designed to display real-time countdowns to the close of current candles across up to five customizable timeframes. It provides a clear panel showing the remaining time until candle close and the candle’s strength as a percentage, ranging from -100% (strong bearish) to +100% (strong bullish), based on the candle’s close position relative to its range. The panel is fully customizable, allowing users to adjust font size, vertical spacing, distance from the last candle, and select preferred timeframes such as M1, M5, M15, M30, H1, and H4. Colors dynamically indicate momentum: green for strong bullish, red for strong bearish, and white for neutral. The panel remains always visible on the chart, facilitating quick assessment of market timing and momentum. This tool is suited for scalpers, day traders, and multi-timeframe traders seeking precise candle timing and momentum insights to improve entry and exit decisions. Parameters include font size, spacing, timeframe selection, and H4 start hour adjustment for brokers with non-standard candle timings. This demo version is intended for evaluation purposes.
Gösterge profili
Müşteri değerlendirmeleri
0.0
Değerlendirmeler: 0
Müşteri değerlendirmeleri
Bu ürün için henüz bir değerlendirme yok. Ürünü denediniz mi? O zaman ona dair görüşlerini paylaşan ilk kişi olun!
Tartışma
SSS
cTrader Store üzerinden erişilebilen işlem botları, göstergeler ve eklentiler gibi ürünler, üçüncü taraf sağlayıcılar tarafından sağlanır ve yalnızca bilgilendirme ve teknik erişim amaçlarıyla sunulur. cTrader Store bir broker değildir ve yatırım tavsiyesi, kişisel öneriler vermez veya gelecekteki performansı garanti etmez.
Bu oluşturanın diğer ürünleri


Fiyat
Başlangıç 31/12/2024
7
Satışlar
1.13K
Ücretsiz yüklemeler