Installation and launch guide
Galeri
.png)
.png)
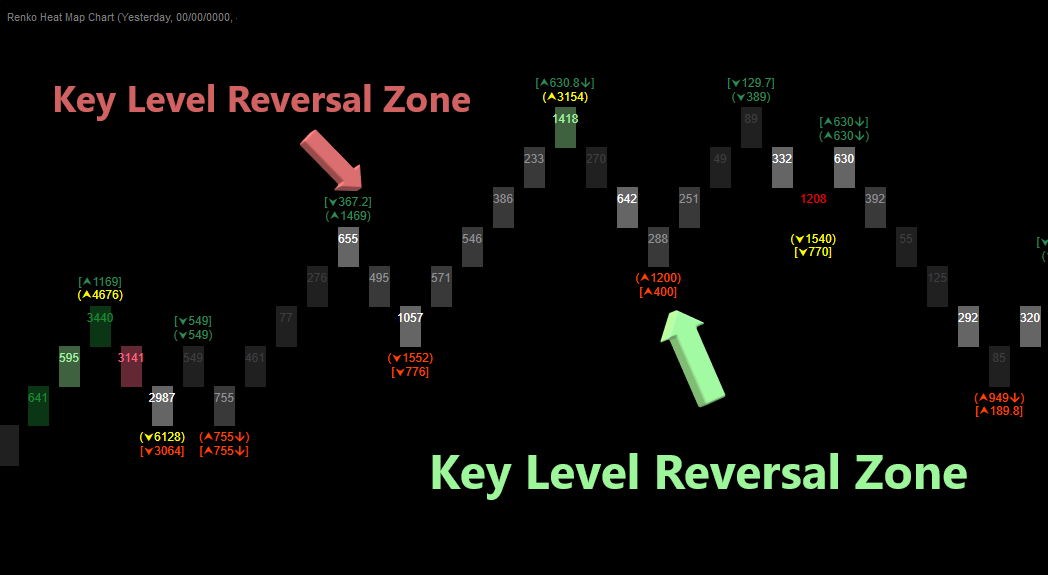
The indicator displays a heatmap within Renko candle formations, presenting lie data updates on the chart. Highlighting key Reversal Zones where significant price movements are likely to occur.


Şunları da beğenebilirsiniz


