
Order Flow Ticks v2.0
Wskaźnik
12.08K pobrania
Wersja 1.1, Jan 2026
Windows, Mac
4.4
Opinie: 23
Opis
Ostatni opis -> 11/11/2025
Każdy aspekt Order Flow Ticks (wersja zagregowana) został starannie zaprojektowany z myślą o wydajności , dzięki czemu może działać nawet na słabszych komputerach.
Niemniej jednak, oto kilka "Wskazówek i porad" dla lepszego użytkowania:
- Dane ticków są przechowywane w pamięci RAM, mimo że cTrader ma już dobrą zarządzanie pamięcią:
-
- Ładuj tylko to, co jest naprawdę potrzebne do handlu na żywo.
- Panel parametrów już pokazuje, które parametry są obsługiwane przez każdy tryb.
- Interwał segmentów może zmieniać analizę filtrów, używaj Dzienny interwał dla momentum intraday.
- Na wyższych ramach czasowych (w tym wykresy oparte na cenie)
-
- Ustaw ODF + VP na Tygodniowy
- Nº dni / Reset dzienny? parametry są teraz Tydzień/Tygodniowy.
- Wszystkie filtry będą resetowane co tydzień zamiast codziennie.
- "Niższa ramka czasowa" z "Małym rozmiarem wiersza":
-
- Niestandardowe MA są stworzone, aby przyspieszyć przeliczanie podczas zmiany ustawień w Panelu parametrów.
- Jeśli chcesz pozostać przy cTrader Moving Averages, ustaw [ODF] Use Custom MAs? na Fałsz
-
- Miej cierpliwość, jeśli jakikolwiek filtr [Wyniki / Spike / Bąbelki] jest aktywowany.
- Jeśli potrzebna jest wysoka wydajność:
-
- Wyłącz Volume Profile i/lub używaj Mini-VP zamiast tego. (domyślnie)
- Używaj "Concurrent" w "[VP] Update Strategy" w "Specyficznych ustawieniach", choć wiąże się to z większym użyciem RAM. (domyślnie)
- Używaj "Redraw_Fastest" w ustawieniach "Performance Drawing" (domyślnie)
- Używaj niestandardowych MA (domyślnie)
- Wszystkie wypełnione i/lub tekstowe rysunki są dość ciężkie, gdy jest ich dużo.
- Podczas testów historycznych niektóre rysunki na wykresach opartych na cenie są uszkodzone, ale działają poprawnie w czasie rzeczywistym.
- Zapisane ustawienia są przechowywane w "Documents/cAlgo/LocalStorage/ODFT-AGG ..."
Nowe funkcje analizy Order Flow Ticks:
- Filtr Spike Ticków
-
- Średnia krocząca lub odchylenie standardowe.
- jako ikona lub bąbelki.
- Poziomy Spike.
- Wykres Spike (bąbelki):
-
- Kolorowanie mapy cieplnej.
- Kolorowanie pozytywne/negatywne.
- Wykres bąbelkowy
-
- Średnie kroczące, odchylenie standardowe lub oba.
- [Delta wolumenu / Skumulowana zmiana delty / Odejmij deltę] jako źródło.
- Poziomy Ultra Bąbelków.
- Kolorowanie mapy cieplnej.
- Kolorowanie momentum:
-
- Zanikające
- Pozytywne/Negatywne
- Volume Profile
-
- Mini-VP - od 5 minut do 1 dnia.
- Profile dzienne, tygodniowe, miesięczne!
- Profile o stałym zakresie.
=============================
Zawsze preferuj wersję ze sklepu cTrader, jest aktualizowana jako pierwsza.
Wszystkie wskaźniki które opracowałem są otwartoźródłowe. Jeśli nie masz dostępu do kodu, sprawdź repozytorium Github
Podsumowanie
Podsumowanie AI
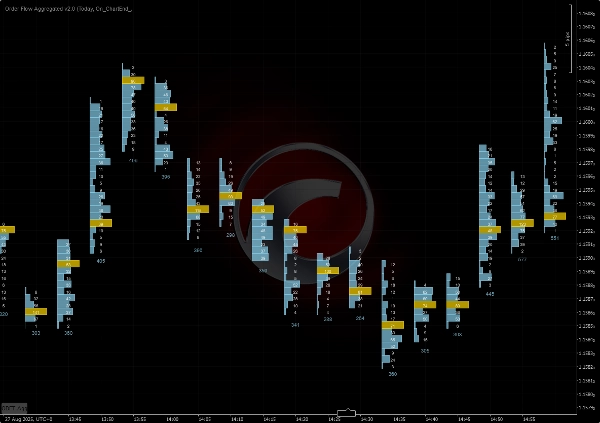
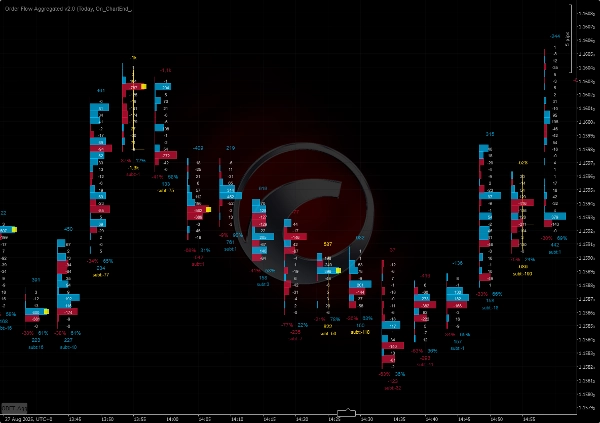
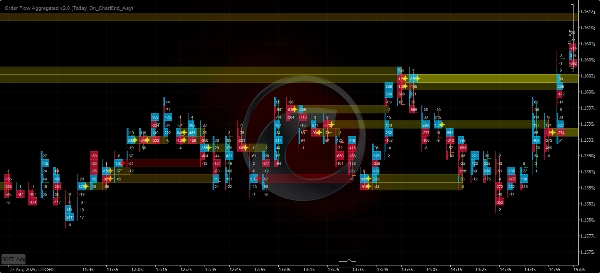
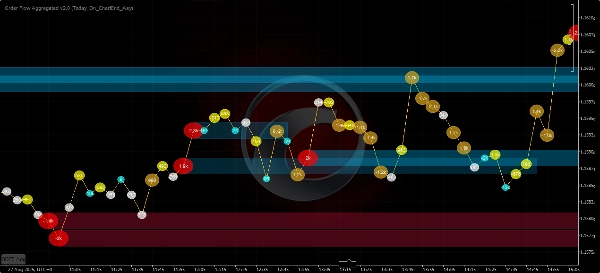
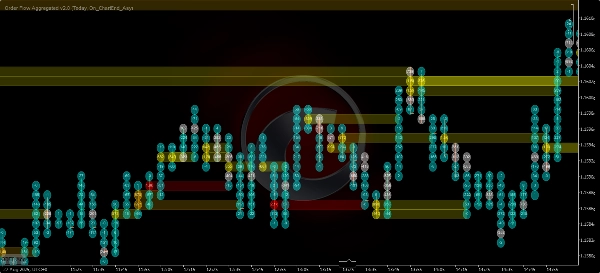
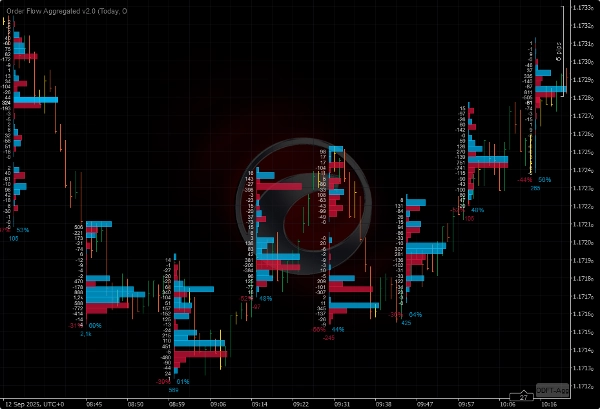
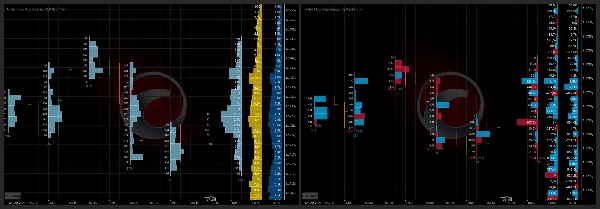
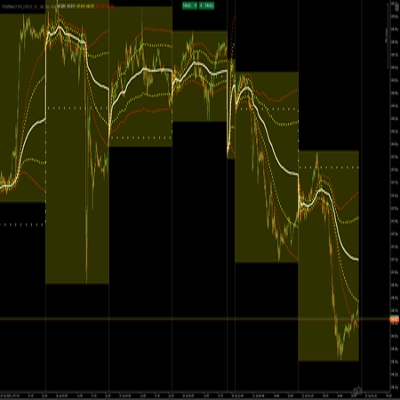
Order Flow Ticks v2.0 is an open-source indicator for the cTrader platform that adapts traditional Order Flow (Footprint) concepts to tick volume data. It supports multiple chart types including ticks, Renko, and range charts. The indicator offers several visualization modes: Normal Mode (volume profile per bar), Buy vs Sell Divided Mode (bid/ask footprint), Buy vs Sell Profile Mode, Delta Divided Mode (delta footprint), and Delta Profile Mode.
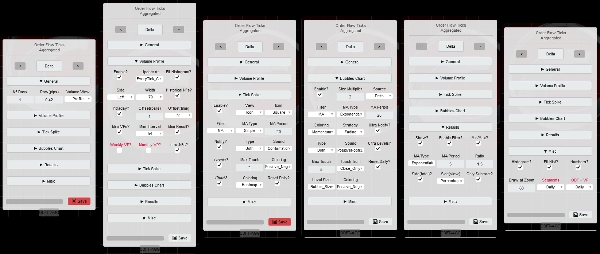
Version 2.0 introduces a parameters panel for quick switching between settings such as volume modes and row height, and it uses the Colors API exclusively. It is compatible with Mac OS and requires .NET 6.0 or higher.
Key features include:
- Tick Spike Filter with moving average or standard deviation, displayed as icons or bubbles with heatmap and positive/negative coloring.
- Bubbles Chart showing volume delta, cumulative delta change, or subtract delta with momentum coloring and ultra bubble levels.
- Volume Profile options including mini-profiles from 5 minutes to 1 day, daily, weekly, monthly, and fixed range profiles.
The indicator is optimized for performance to run efficiently on lower-end machines. It stores tick data in RAM and offers settings to balance performance and detail, including custom moving averages and concurrent update strategies. Saved settings are stored locally.
Profil wskaźnika
Opinie klientów
4.4
Opinie: 23
5 | 74 % | |
4 | 13 % | |
3 | 4 % | |
2 | 0 % | |
1 | 9 % |
Opinie klientów
May 13, 2026
Just a note to say thank you to the creator for making this free of charge. Appreciate it.
March 23, 2026
It's great, Thank you! Can you pls make an update, it doesnt work fully on Indices on CFD
March 9, 2026
"Thank you very much for your work on Order Flow Tick 2.0. It is truly excellent and unique."
October 22, 2025
this is great, i just can't see all the options because the panel is cut short. i don't have access to the bubbles and other features that are apparently there in the code
September 27, 2025
August 3, 2025
Amazing indicator! Once you learn how to use it it really helps out so much, love it!
July 9, 2025
Pros: Real-time tick flow visualization with buy/sell separation. Helps assess market activity and hidden liquidity. Easy to set up, works stable on major assets. Cons: No alerts on tick spikes. No history or tooltips. Requires experience to interpret data correctly.
July 3, 2025
June 20, 2025
Great indicator. It takes a bit of work to learn how to use it properly. Not to be used in isolation, you need to plan potential reversal zones.
April 15, 2025
This looks promising! I tested it out manually, but I would love to automate it! How could we get the source code? :) Really, Pls.
Dyskusja
Częste pytania
VWAP
Produkty dostępne za pośrednictwem cTrader Store, w tym boty handlowe, wskaźniki i wtyczki, dostarczane są przez deweloperów zewnętrznych i udostępniane wyłącznie w celach informacyjnych oraz w celu zapewnienia dostępu technicznego. cTrader Store nie jest brokerem i nie zapewnia doradztwa inwestycyjnego, nie udziela spersonalizowanych rekomendacji ani nie gwarantuje przyszłych wyników.


Cena
Od 12/12/2024
1
Sprzedaż
33.19K
Bezpłatne instalacje