Açıklama
📌 Gösterge Ne Yapar
MarketStructureOscSignals bir saf fiyat hareketi sinyal aracıdır.
Şunları yapar:
- Sol/sağ geriye bakış kullanarak swing yüksekleri ve swing düşüklerini tespit eder.
- Bu swinglerin şu yapıda olup olmadığını takip eder:
-
- Daha Yüksek Yüksekler + Daha Yüksek Düşükler → Boğa yapısı
- Daha Düşük Yüksekler + Daha Düşük Düşükler → Ayı yapısı
- Yapı değiştiğinde:
-
- Ayıdan → boğaya → bir ALIŞ sinyali çizer
- Boğadan → ayıya → bir SATIŞ sinyali çizer
Yani her sinyal sadece hareketli ortalama kesişimi değil, gerçek bir piyasa yapısı değişimini temsil eder.
⚙️ Girdiler ve Nasıl Ayarlanır
1. Swing Left / Swing Right
Bunlar bir swing yüksek/düşüğünün ne kadar “katı” olduğunu kontrol eder.
- Swing Left (varsayılan 2)
Swingin solundaki bar sayısı; swing yüksek için daha düşük yüksekler, swing düşük için daha yüksek düşükler olmalıdır. - Swing Right (varsayılan 2)
Swingin sağında da onaylayan bar sayısı.
Nasıl kullanılır:
- Küçük değerler (1–2):
-
- Daha fazla swing, daha fazla sinyal
- daha yüksek zaman dilimlerinde (H1, H4, D1) iyi çalışır
- Büyük değerler (3–4+):
-
- Sadece büyük yapısal dönüşler
- Daha az ama daha güçlü sinyaller
- Gürültüyü önlemek için daha düşük zaman dilimlerinde iyi
2. Min Bars Between Signals
İki sinyal arasında geçmesi gereken minimum bar sayısı.
- Her küçük geri çekilmede okların kümeleşmesini önler.
- Örnek:
-
- 3 olarak ayarlanırsa → bir sinyal ile diğer sinyal arasında en az 3 bar olur.
- Çok hızlı grafiklerde (M1–M5) 5–10 tercih edilebilir.
- H1 veya daha yüksek zaman dilimlerinde genellikle 2–3 yeterlidir.
3. Arrow Offset (pips)
Ok ve etiketin mumdan ne kadar uzak yerleştirileceği (pip cinsinden).
- Forex için:
-
5–10pip genellikle iyi görünür.
- Endeksler için (US500, US100, vb.):
-
- Daha büyük bir offset kullanın (örneğin broker pip büyüklüğüne bağlı olarak 20–50 “pip”).
Oklar mumların üzerine biniyorsa bu değeri artırın.
Çok uzaklarsa azaltın.
4. ALIŞ/SATIŞ Metnini Göster
true→ hem ok (↑/↓) hem de “ALIŞ” veya “SATIŞ” metni gösterir.false→ sadece oklar.
Grafik karışık görünüyorsa metni gizleyip sadece okları tutabilirsiniz.
🔍 Sinyaller Nasıl Oluşur (Mantık)
Gösterge dahili olarak:
- En son iki swing yüksek ve iki swing düşük bilgisini tutar:
-
_prevHigh,_lastHigh_prevLow,_lastLow
- Bunlardan şunları kontrol eder:
-
- Yüksekler ve düşükler her ikisi de yükseliyor mu?
-
- → Boğa trendi (
StructureTrendSignal.Bullish)
- → Boğa trendi (
- Yüksekler ve düşükler her ikisi de düşüyor mu?
-
- → Ayı trendi (
StructureTrendSignal.Bearish)
- → Ayı trendi (
- Eğer uyumlu değillerse, önceki trend korunur.
- Yapısal trend her değiştiğinde:
-
Ayı → Boğa→ ALIŞ sinyaliBoğa → Ayı→ SATIŞ sinyali
- Ayrıca şunları sağlar:
-
- Trend
Unknowndeğil (yani en başta değil). - Son sinyalden beri yeterli bar geçmiş (
MinBarsBetweenSignals).
- Trend
Bu, her okun gerçek yapısal değişimi işaret ettiği, rastgele gürültü olmadığı anlamına gelir.
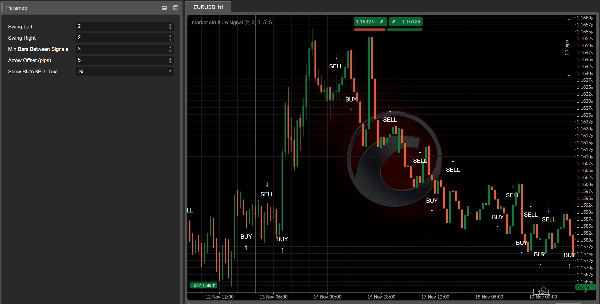
📈 Grafik Üzerinde ALIŞ/SATIŞ Sinyalleri Nasıl Okunur
✅ ALIŞ Sinyali
Gördüğünüz:
- Mumun altında bir yukarı ok
↑ - İsteğe bağlı olarak ok yakınında “ALIŞ” metni
Anlamı:
- Yapı ayıdan → boğaya değişti.
- Son swing yüksekleri ve düşükleri artık her ikisi de yükseliyor.
- Piyasa muhtemelen yeni bir yükseliş trendine geçiyor veya boğa yapısını sürdürüyor.
Nasıl kullanılır:
- Uzun pozisyon girişleri arayın:
-
- Sinyal mumunda veya sonraki birkaç mumda.
- Tercihen küçük bir geri çekilmeden sonra destek seviyesine (önceki swing düşük, talep bölgesi, VWAP, VA düşük vb.)
- Filtrelemek için Kalman Trend / EMA / Hacim Profili gibi araçları kullanın:
-
- Yalnızca daha yüksek zaman dilimi veya Kalman da boğaysa ALIŞ alın.
✅ SATIŞ Sinyali
Gördüğünüz:
- Mumun üzerinde bir aşağı ok
↓ - İsteğe bağlı olarak “SATIŞ” metni
Anlamı:
- Yapı boğadan → ayıya değişti.
- Swing yüksekleri ve düşükleri artık her ikisi de düşüyor.
- Piyasa muhtemelen bir düşüş trendine giriyor veya ayı yapısını sürdürüyor.
Nasıl kullanılır:
- Kısa pozisyon girişleri arayın:
-
- Sinyal mumunda veya direnç yakınındaki sonraki mumlarda.
- Kırılmış destek (şimdi direnç), VAH, arz bölgesi vb. yeniden testinden sonra ideal.
🎯 Pratik Ticaret Kullanımları
1. Bağımsız Giriş Aracı Olarak
Basit kural seti:
- Alış Kurulumu
-
- Bir ALIŞ oku bekleyin.
- Sinyal mumunda veya yakınında uzun pozisyon açın.
- Stop loss’u son swing düşük seviyesinin altına koyun.
- Hedef olarak önceki swing yüksek veya önemli bir direnç belirleyin.
- Satış Kurulumu
-
- Bir SATIŞ oku bekleyin.
- Sinyal mumunda veya yakınında kısa pozisyon açın.
- Stop loss’u son swing yüksek seviyesinin üstüne koyun.
- Hedef olarak önceki swing düşük veya önemli bir destek belirleyin.
Bu en temel kullanımdır ve yapının daha temiz olduğu H1, H4 ve D1 zaman dilimlerinde en iyi sonucu verir.
2. Diğer Göstergelerinizle Onay Aracı Olarak
Burada güçlenir.
🔹 Kalman Filtre Trendi ile
- Sadece ALIŞ sinyallerini alın, eğer:
-
- Kalman Trendi yukarı eğimli ve fiyat Kalman çizgisinde veya üzerinde.
- Sadece SATIŞ sinyallerini alın, eğer:
-
- Kalman Trendi aşağı eğimli ve fiyat Kalman çizgisinde veya altında.
Etkisi:
Kalman size düzgün bir trend verir, MarketStructureOscSignals size kesin yapısal değişimler sağlar. Birlikte birçok kötü işlemi filtrelerler.
🔹 Hacim Profili / Destek & Direnç ile
- Güçlü ALIŞ:
-
- ALIŞ oku VA Düşük, önceki swing düşük veya likidite süpürgesi yakınında ve reddedilme ile.
- Güçlü SATIŞ:
-
- SATIŞ oku VA Yüksek, önceki swing yüksek veya likidite süpürgesi yakınında tepede.
Burada sinyal sadece teknik bir desen değil, aynı zamanda likidite ve emir akışı bölgelerine dayanır.
3. Ölçeklendirme İçin
Yeni sinyalleri ayrıca şunlar için kullanabilirsiniz:
- Pozisyona Ölçeklendirme Noktaları
Mevcut işleminizle aynı yönde yeni bir sinyal göründüğünde ve daha yüksek zaman dilimi uyumluysa pozisyona ekleyin. - Erken Çıkış / Kısmi Çıkış
Uzun pozisyondaysanız ve pozisyonunuza karşı bir SATIŞ sinyali (özellikle önemli yapıya yakın) görünürse, şunları yapabilirsiniz: -
- Pozisyonun bir kısmını kapatın
- Veya stopları sıkılaştırın
🧪 Tavsiye Edilen Başlangıç Ayarları
İçin Forex H1 / H4:
Swing Left = 2Swing Right = 2Min Bars Between Signals = 3Arrow Offset = 5–10 pips
İçin Endeksler M15 / H1:
Swing Left = 2–3Swing Right = 2–3Min Bars Between Signals = 5Arrow Offsetsembole göre uyarlanmıştır (örneğin broker’a bağlı 20–50 “pip”)
İçin Kripto H1 / H4:
- Gürültüyü filtrelemek için biraz daha yüksek swingler:
-
Swing Left = 3Swing Right = 3Min Bars Between Signals = 4–6
Her zaman tercih ettiğiniz enstrüman ve zaman dilimi ile geri test yaparak Swing ve MinBarsBetweenSignals değerlerini ince ayar yapın.
Özet
Müşteri değerlendirmeleri
5 | 100 % | |
4 | 0 % | |
3 | 0 % | |
2 | 0 % | |
1 | 0 % |


