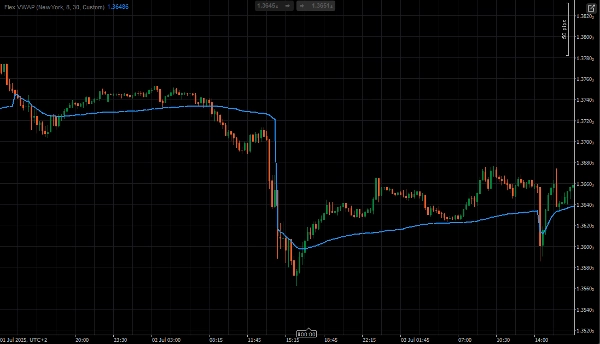
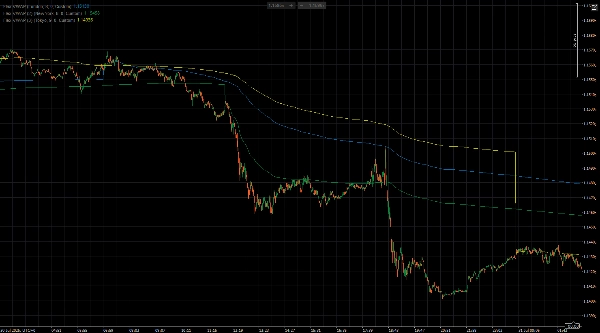
Broker'lar ve Prop'lar
İşletmeler için
00
Days
:
00
Hours
:
00
Minutes
:
00
Seconds
Flex VWAP
"Flex VWAP" logosu
Başlangıç 15/06/2025
Ücretsiz yüklemeler
353
"Flex VWAP" yüklenen resmi"Flex VWAP" yüklenen resmi

The Flex VWAP indicator provides a volume-weighted average price calculation with highly customizable reset periods including yearly, monthly, weekly, daily, hourly intervals, and custom time settings. It supports multiple timezone configurations (New York, London, Tokyo, Sydney, Local) allowing traders to align VWAP calculations with specific trading sessions. Users can set custom reset times down to the minute for precise session management and personalized trading strategies. The VWAP line updates in real-time using typical price methodology and provides a reliable reference for institutional trading levels and market bias analysis.

Forex Session Settings
==================

London Session
Base TimeZone: London
Custom Hour: 8
Custom Minute: 0
Reset Period: Custom

New York Session
Base TimeZone: NewYork
Custom Hour: 8
Custom Minute: 0
Reset Period: Custom

Tokyo Session
Base TimeZone: Tokyo
Custom Hour: 9
Custom Minute: 0
Reset Period: Custom


Stock Exchange Session Settings
==========================

London Session
Base TimeZone: London
Custom Hour: 8
Custom Minute: 0
Reset Period: Custom

New York Session
Base TimeZone: NewYork
Custom Hour: 9
Custom Minute: 30
Reset Period: Custom

Tokyo Session
Base TimeZone: Tokyo
Custom Hour: 9
Custom Minute: 0
Reset Period: Custom

5.0
Değerlendirmeler: 1
5
100 %
4
0 %
3
0 %
2
0 %
1
0 %
Müşteri değerlendirmeleri
July 14, 2025
Same as description, good parameters
Bu oluşturanın diğer ürünleri
Simple MACD Histogram
Simple MACD Histogram with color-coded rising (green) and falling (red) momentum bars.
Şunları da beğenebilirsiniz
Candles_Painter
Overlay HTF context on any chart: color bars by HTF and draw filled HTF bodies with optional High/Low lines.
En yüksek puanlı
Ücretsiz
FairValueGap
This Fair Value Gap (FVG) indicator is a technical analysis tool used to identify potential price imbalances.
Indicatore livelli numeri tondi_fabio23.traders
Indicatore dei livelli numeri tondi sul grafico , regolabile.Indicator of levels round numbers on the graph, adjustable
Gösterge
NAS100
NZDUSD
XAUUSD
+14
Volume Profile Pivot Anchored
Anchor volume profiles to pivots with POC, VAH, VAL and real-time insights for clearer trade decisions.
Range 10 Rsi
RSI Scalping cBot: quick‑fire trades on choppy symbols.
Gösterge
Breakout
Stocks
Signal
Darvas Box
The Darvas Box involves identifying "boxes" or trading ranges where a stock's price consolidates before breaking out.
Gösterge
Indices
RSI
ATR
+3
Divergency 1.1_withSourceCode
🔍 Divergence Indicator for cTrader (Update v1.1)
SmartBot-Tenkan & ATR Indicator
The Tenkan-ATR Indicator is a powerful and innovative indicator for Traders. SALE OFF!!!
Gösterge
NAS100
NZDUSD
Breakout
+17
OHLC and SMC - Market Structure
Multi-TF OHLC, NY Midnight, ZigZag & Gann S/R—clean visuals for SMC, scalping, and intraday precision.
TraderMaxBBflterXDemo-
TraderMax BB Filter X (DEMO) for cTrader 🧪 Limited-Time Demo Version (24h) TraderMax BB Filter X (DEMO) is a precision
Gösterge
NAS100
NZDUSD
XAUUSD
+12
WT - PJER
Price Jump Exit & Re-Entry Indicator - Statistical boundaries that adapt to real-time volatility.
Gösterge
Indices
Prop
Stocks
+3
4MA
This indicator consists of 3 moving averages that can be configured to your liking, from the type of moving average....
Gösterge
Grid
NAS100
NZDUSD
+16
Frac Support Resistance V1
Smart Support/Resistance lines auto calculated from D1/H4/H1/M15. Highly customizable visuals + built in Backtest Mode.
Gösterge
NAS100
NZDUSD
Indices
+7
Hull Moving Average Colored
The traditional Hull Moving Average with different colours based on the slope (direction) of the trend.
Gösterge
RSI
Breakout
XAUUSD
+13
Fear & Greed Index
Fear & Greed Index: 4 configurable components (momentum, volatility, strength, pattern) with 6 calculation methods each
Gösterge
XAUUSD
Commodities
Forex
+5
BullBear Dynamics
BullBear Dynamics helps traders detect and interpret the balance between bullish and bearish momentum
Candlestick Patterns - Special Candles
Boost your trading with Candlestick Patterns for cTrader – auto-detect key signals for smarter, faster decisions!