Açıklama
Sorun: Bilgi Aşırı Yüklemesi
Çoğu trader, grafiklerinin gecikmeli göstergeler ve çok fazla çizgi ile dolu olması nedeniyle başarısız olur. En önemli şeyi gözden kaçırırlar: Piyasa Yapısı.
Çözüm: Trend Yönü Yapısı
Bu gösterge, cTrader platformu için "İki Bir Arada" güçlü bir araçtır. Profesyonel düzeyde Salınım Tespiti ile objektif bir Puanlama Motoru birleştirir ve size piyasanın tam olarak kim tarafından kontrol edildiğini söyler.
Ana Özellikler:
- Akıllı Yapı Haritalaması: ATR filtreli volatilite kullanarak önemli Destek ve Direnç seviyelerini otomatik olarak tanımlar.
- SGE Puanlama Motoru: Yapısal seviyelerin kaç tanesinin kırıldığına bağlı olarak trend gücünü hesaplayan benzersiz bir derecelendirme sistemi (-2, 0, +2).
- Dağınıklık Önleyici Teknoloji: Sadece mevcut fiyata en yakın 3 ilgili seviyeyi gösterir. Grafiğiniz temiz, profesyonel ve uygulanabilir kalır.
- Momentum Tespiti: Gerçek kurumsal destekli hareketlerle işlem yapmanızı sağlamak için "Büyük Mum" mantığını kullanır.
- Tamamen Özelleştirilebilir: Hassasiyeti belirli varlığınıza (XAUUSD, Forex veya Endeksler) göre ayarlayın.
Nasıl İşlem Yapılır:
- Puanı Kontrol Edin: +2 (Boğa) veya -2 (Ayı) puanlarını arayın.
- Geri Çekilmeyi Bekleyin: Fiyatın çizilen Yapı Çizgilerinden birine dönmesini bekleyin.
- İşlem Yapın: Yönü kullanarak, seviyeleri giriş/çıkış noktalarınız olarak kullanarak işlem yapın.
Teknik Özellikler
- Platform: cTrader
- Dil: C# (.NET)
- Zaman Dilimleri: Tüm zaman dilimlerinde çalışır (M1'den Aylığa kadar).
- Varlıklar: Yüksek likiditeli çiftler için optimize edilmiştir (XAUUSD, EURUSD, GBPUSD).
Not: Başlangıç Ayarları: Çoğu büyük çift için varsayılan ayarlar optimize edilmiştir. Volatil endekslerle işlem yapıyorsanız, Range Global ATR Mult değerini 2.0 olarak artırmak isteyebilirsiniz.
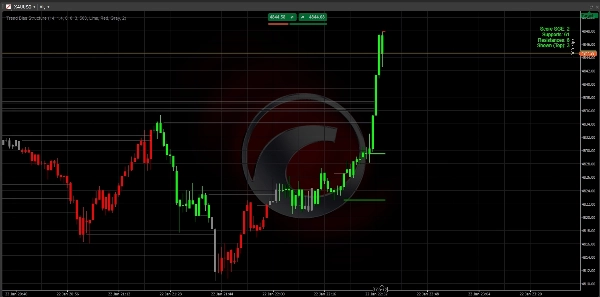
Önemli: Gösterge Panelini Okuma
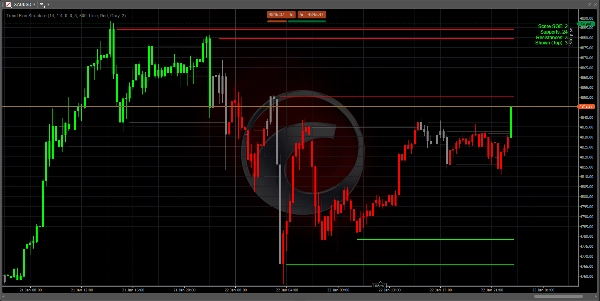
Sağ üst köşedeki gösterge paneli sizin komuta merkezinizdir:
- Puan +2 (Yeşil): Güçlü Boğa. Sadece Alış fırsatlarına bakın.
- Puan -2 (Kırmızı): Güçlü Ayı. Sadece Satış fırsatlarına bakın.
- Puan 0 (Gri): Nötr. Piyasa yatay seyrediyor veya geçiş aşamasında. Sabırlı olun.
- Destekler/Dirençler: Mevcut trendde kaç tane tarihsel "taban" ve "tavan" olduğunu gösterir.
3 Adımlı Giriş Stratejisi
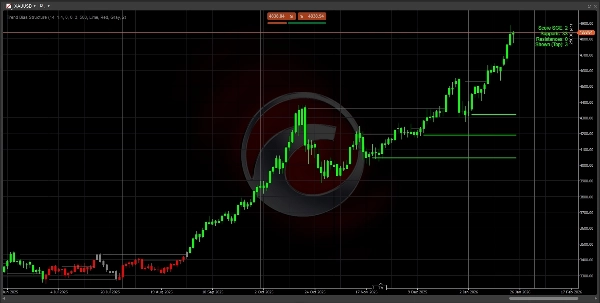
Adım 1: Yönü Belirle Mum renkleri ve Gösterge Paneli puanı +2 veya -2 olduğunda bekleyin. Bu, piyasanın yapıyı kırdığını ve bir trendin başladığını doğrular.
Adım 2: Değer Alanı Fiyatın peşinden koşmayın. Fiyatın grafiğinizde çizilen en yakın 3 çizgiden birine doğru geri çekilmesini (düzeltme) bekleyin.
- Düşüş trendinde (Puan -2), fiyatın bir Kırmızı Çizgiye dokunmasını bekleyin.
- Yükseliş trendinde (Puan +2), fiyatın bir Yeşil Çizgiye dokunmasını bekleyin.
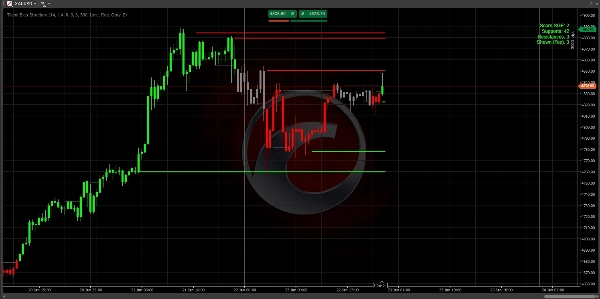
Adım 3: İşlem Fiyat çizgiye dokunduğunda ve bir reddediş (fitil oluşumu) gösterdiğinde işleminizi başlatın.
- Stop Loss: SL'nizi yapısal çizginin hemen arkasına yerleştirin.
- Take Profit: Trend yönündeki bir sonraki yapısal çizgiyi hedefleyin.
Başarı İçin Profesyonel İpuçları
- Daha Yüksek Zaman Dilimleri Kuralı: H4 veya D1 grafiklerinde +2 puan, M5 grafiğindeki bir puandan çok daha güçlüdür. Yönü bulmak için daha yüksek zaman dilimini, giriş için ise daha düşük zaman dilimini kullanın.
- Temiz Grafikler: Ekran yoğun görünüyorsa, ayarlara gidip
Max Levels to Showdeğerini 2 olarak değiştirin. Bu size sadece en kritik "Taban" ve "Tavan" seviyelerini gösterecektir. - "Sıfır" Bölgesi: Puan 0 olduğunda piyasa "yeniden hesaplama" yapıyor demektir. Bu, önceki işlemlerden kar alıp yeni bir kırılmayı beklemek için en iyi zamandır.
Sorun Giderme
- Çizgi Görünmüyor mu? Grafiğinizde yeterince geçmiş veri yüklü olup olmadığını kontrol edin. Gösterge ATR ve Salınım seviyelerini hesaplamak için en az 100-200 bar gerektirir.
- Gösterge Gecikmeli mi? Bilgisayarınız yavaşsa,
Max Historical Linesayarını 200 olarak düşürün, böylece bellek daha hızlı temizlenir.
Sıkça Sorulan Sorular (SSS)
S: Bu gösterge yeniden çizim yapar mı?
C: Hayır. Seviyeler ve puanlar, onaylanmış mum kapanışlarına dayanarak hesaplanır. Bir seviye kırıldığında veya puan mum kapanışında değiştiğinde, geçmişe kilitlenir.
S: En iyi zaman dilimi hangisidir?
C: Mantık evrenseldir. Ancak çoğu profesyonel trader, "Kurumsal Yapıyı" tanımlamak için H1, H4 veya Günlük grafiklerini kullanır. M1 veya M5'te scalp yapıyorsanız, daha sık puan değişiklikleri bekleyin.
S: Bunu diğer göstergelerle kullanabilir miyim?
C: Evet! Mükemmel bir "Yön Filtreleyici" olarak çalışır. Örneğin, sadece Trend Yönü Puanı +2 ise RSI aşırı satım sinyallerini alın.
İyi Alımlar!
Finansal Tavsiye Değildir. Trend Yönü Yapısı göstergesi, traderların piyasa yapısını ve trend yönünü tanımlamalarına yardımcı olmak için tasarlanmış teknik analiz aracıdır.
Özet
Key features include:
- Smart Structure Mapping: Automatically detects significant support and resistance levels filtered by ATR-based volatility.
- SGE Scoring Engine: Calculates trend strength by counting breached structural levels.
- Anti-Clutter Display: Shows only the three closest relevant levels to maintain chart clarity.
- Momentum Detection: Uses "Big Candle" logic to highlight moves with institutional backing.
- Customizable sensitivity for different assets such as XAUUSD, EURUSD, GBPUSD, and indices.
The indicator works on all timeframes from 1 minute to monthly, with professional traders typically using H1, H4, or daily charts to identify institutional structure. The dashboard provides a clear bias score and structural levels to guide trade entries and exits. Users are advised to trade with the bias, waiting for price pullbacks to the nearest structure lines before executing trades.
This tool is intended as a directional filter and can be combined with other indicators like RSI. It does not repaint, as calculations are based on confirmed candle closes.
Müşteri değerlendirmeleri
5 | 100 % | |
4 | 0 % | |
3 | 0 % | |
2 | 0 % | |
1 | 0 % |