Açıklama
Bu gösterge, Smart Money Market Theory (ICT/SMC) kavramlarını takip ederek piyasadaki likidite bölgelerini ve emir bloklarını tanımlar.
https://ctrader.com/pt/products/1560
https://ctrader.com/pt/products/1386
Gösterge dört ana adımda çalışır:
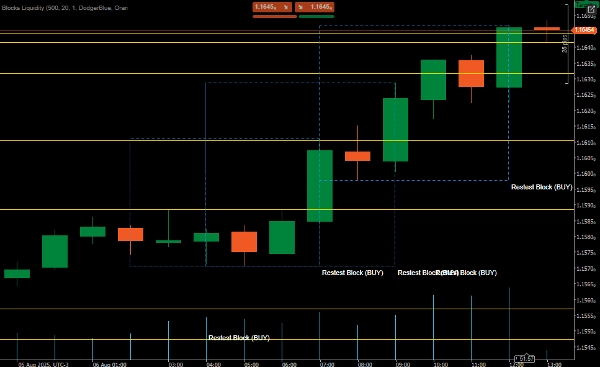
✅Emir Bloğu Tanımlama
İmpulsif hareketleri algılar (varsayılan olarak minimum 20 pip)
İmpuls öncesi konsolidasyon bölgelerini bulur
Alım veya satım bloğu olarak sınıflandırır
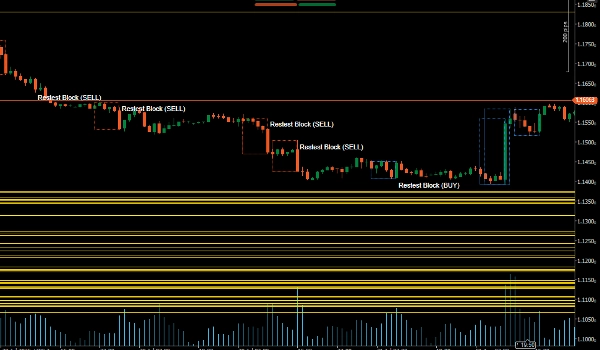
✅Likidite Havuzu Tanımlama
Son yüksek ve düşükleri likidite bölgeleri olarak işaretler
Bu alanlar potansiyel hedefler veya durma noktalarını temsil eder
✅Retest Onayı
Fiyatın emir bloklarına geri döndüğünü kontrol eder
Dönüş formasyonları (Pin Bar/Engulfing) ve hacim ile onaylar
✅Grafik Görselleştirme
Emir bloklarını ve likidite bölgelerini çizer
Onay anında sesli uyarılar verir
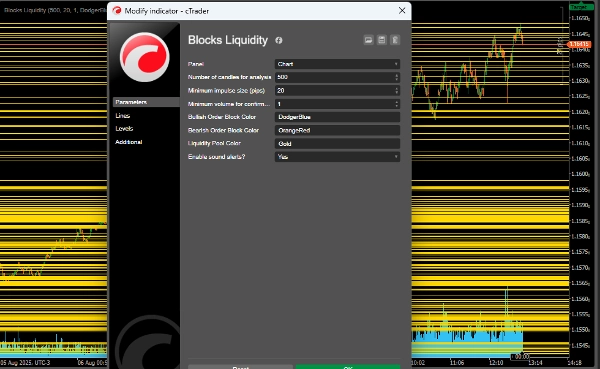
✅Yapılandırılabilir Parametreler
LookbackPeriod: Analiz edilecek mum sayısı (varsayılan 500)
MinImpulsePips: İmpulsif hareketin minimum büyüklüğü (20 pip)
MinVolumeThreshold: Onay için minimum hacim (1.0)
Boğa/ayı blokları ve likidite bölgeleri için özelleştirilebilir renkler
Sesli uyarı seçeneği
✅Alım Satım Mantığı
Boğa (alım) blokları:
Konsolidasyon ve yukarı yönlü momentum sonrası oluşur
Potansiyel destek bölgesi
Retest sırasında dönüş formasyonu + hacim ile giriş onaylanır
Ayı (satım) blokları:
Konsolidasyon ve aşağı yönlü momentum sonrası oluşur
Potansiyel direnç bölgesi
Giriş aynı şekilde onaylanır
✅Likidite Havuzları:
Hedefler veya durdurma noktaları olarak son yüksekler/düşükler
Stop emirlerinin yoğunlaşmasının muhtemel olduğu alanlar
Özet
Key features include:
- Order Block Identification: Detects bullish and bearish blocks formed after consolidation and momentum shifts, serving as potential support or resistance zones.
- Liquidity Pool Identification: Highlights recent highs and lows that may act as targets or stop areas due to stop order concentration.
- Retest Confirmation: Validates entries by checking price returns to order blocks combined with reversal candlestick patterns (Pin Bar, Engulfing) and volume thresholds.
- Chart Visualization: Draws order blocks and liquidity zones with customizable colors and provides sound alerts upon confirmation.
- Configurable parameters such as lookback period, minimum impulse size, and volume threshold allow adaptation to different trading preferences.
This indicator supports analysis of price action dynamics to assist traders in identifying key market levels and potential trade entry points.
Müşteri değerlendirmeleri
5 | 100 % | |
4 | 0 % | |
3 | 0 % | |
2 | 0 % | |
1 | 0 % |


!["Gaussian Channel [Iridio Capital]" logosu](https://cdn.ctrader.com/image/webp/7c039209-5573-4a54-a072-f9528b503103_41960)


