Açıklama
Trendlines Osilatörü Trendlines Osilatörü ticaret yapanların mevcut fiyat ile en son tespit edilen yükseliş ve düşüş trend çizgileri arasındaki normalize edilmiş mesafelere dayanarak trendleri ve momentumu tanımlamasına yardımcı olur.
Gösterge, yükseliş ve düşüş momentumu, kesişimlere sahip bir sinyal hattı ve birden fazla düzeltme seçeneği içerir.
KULLANIM
Trendlines Osilatörü Trendlines Osilatörü sistematik olarak çalışır:
- Pivot yüksek ve düşüklerini tanımlamak.
- Pivotları birleştirerek yükseliş (destek) ve düşüş (direnç) trend çizgileri oluşturmak.
- Mevcut fiyat ile bu trend çizgileri arasındaki mesafeyi (delta) ölçmek.
- Bu mesafeleri 0 ile 100 arasında normalize ederek momentum değerleri oluşturmak.
- Daha temiz sinyaller için değerleri düzeltmek.
- Momentum sinyal hattını kestiğinde yükseliş ve düşüş sinyalleri üretmek.
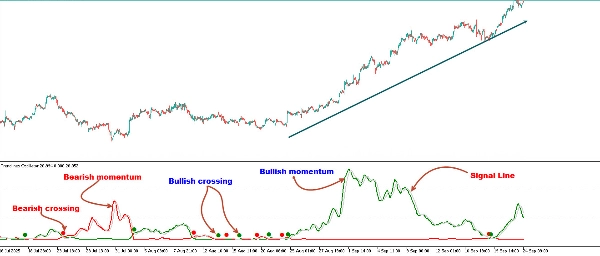
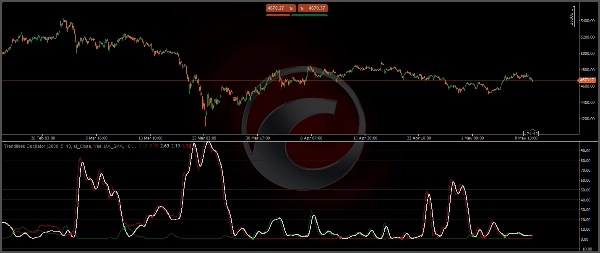
Osilatör üç ana çizgiyi gösterir:
Yükseliş Momentum Hattı (Yeşil): Alıcı gücünü, fiyatın son yükseliş destek trend çizgilerinden ne kadar uzakta olduğunu hesaplayarak ölçer.
Düşüş Momentum Hattı (Kırmızı): Satıcı gücünü, fiyatın son düşüş direnç trend çizgilerinden ne kadar uzakta olduğunu hesaplayarak ölçer.
Sinyal Hattı (Gri): Potansiyel ticaret fırsatlarını vurgulamak için momentum hatları ile kesişimler sağlar.
Genel bir kural olarak, yükseliş momentum hattı düşüş momentum hattının üzerindeyse, bu alıcı gücünü gösterir. Bu, gerçek fiyatların destek trend çizgilerinden direnç trend çizgilerinden daha uzak olduğu anlamına gelir. Satıcı gücü için durum bunun tersidir.
Yükseliş momentumu hesaplamak için araç önce fiyatın altındaki destek olarak hareket eden yükseliş trend çizgilerini tanımlar. Ardından, fiyat ile bu trend çizgileri arasındaki delta ölçülür ve okuma gösterilen momentum değerlerine normalize edilir.
Aynı işlem düşüş momentumu için de kullanılır, ancak fiyatın üzerindeki direnç olarak hareket eden düşüş trend çizgileri ile.
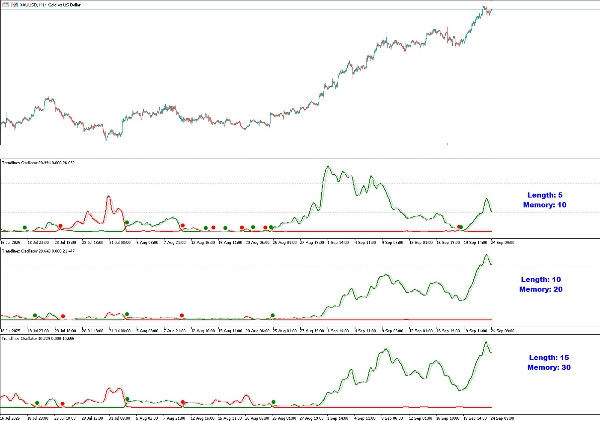
Uzunluk ve Bellek
- Uzunluk: Trend çizgilerini tespit etmek için kullanılan piyasa yapısının boyutunu belirler. Daha büyük değerler daha geniş trendleri yakalarken, daha küçük değerler aracı kısa vadeli hareketlere karşı daha hassas yapar.
- Bellek: Hesaplamalarda dikkate alınan trend çizgilerinin sayısını kontrol eder. Daha yüksek bellek değerleri uzun vadeli analiz için sinyalleri düzeltirken, daha küçük bellek değerleri daha hızlı tepkiler sunar.
Uzunluk ve Bellek değerlerini değiştirmek, aracın farklı momentum değerleri göstermesine neden olur.
Tüccarlar, daha büyük trend çizgilerini tespit etmek için uzunluğu ve aracın dikkate alması gereken trend çizgisi sayısını belirtmek için belleği ayarlayabilir.
Yukarıdaki grafik gösterdiği gibi, daha küçük değerler aracı daha duyarlı yaparken, daha büyük değerler daha büyük trendleri tespit etmek için faydalıdır.
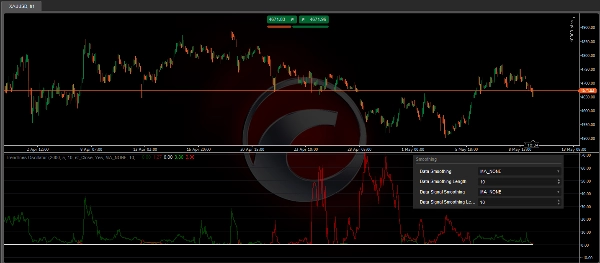
Düzeltme
- Veri Düzeltme: Ham momentum değerlerine düzeltme uygular.
- Sinyal Düzeltme: Daha net kesişim noktaları için sinyal hattını düzeltir.
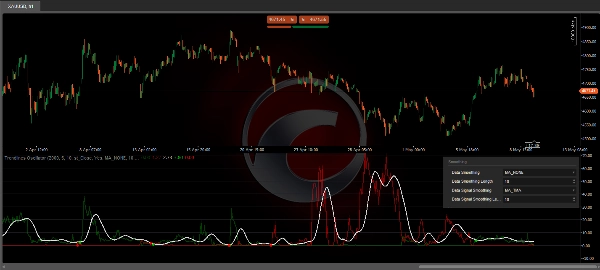
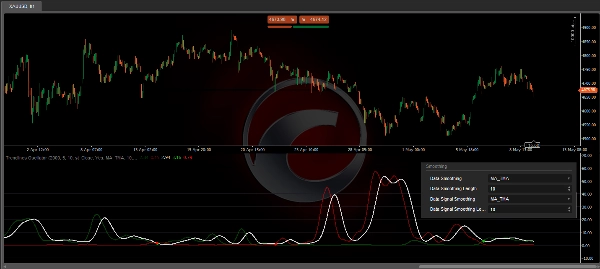
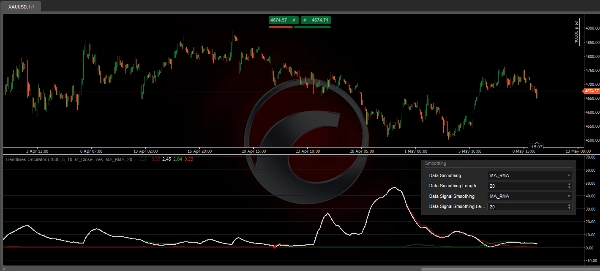
Varsayılan olarak, veri SMA ile düzeltilir ve sinyal 10 uzunluğunda üçgen hareketli ortalama kullanır. Tüccarlar hem veriyi hem de sinyal hattını düzeltebilir.
Tüccarlar farklı yöntemler veya hiçbiri arasında seçim yapabilir. Bazı örnekler ekli resimlerde gösterilmiştir.
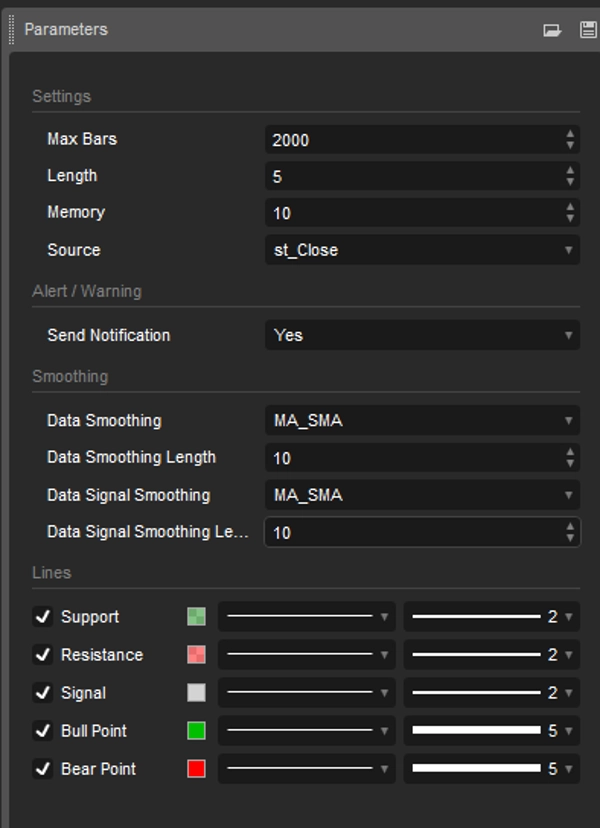
AYARLAR
- Uzunluk: Trend çizgisi tespiti için kullanılan piyasa yapısının boyutu.
- Bellek: Hesaplamalarda kullanılan trend çizgilerinin sayısı.
- Kaynak: Hesaplamalar için varsayılan olarak kapanış fiyatları kullanılır.
- Veri Düzeltme: Düzeltme yöntemi ve uzunluğunu seçin
- Sinyal Düzeltme: Düzeltme yöntemi ve uzunluğunu seçin
- Uyarı: Yükseliş/Düşüş Kesişiminde Uyarı/Bildirim
- Stiller: Destek/Direnç/Sinyal çizgilerinin renk, stil, genişliğini ayarlayın
Trendlines Osilatörü ticaret göstergesi, aşağıdakileri isteyen tüccarlar için idealdir:
- Yalnızca hareketli ortalamalara veya RSI'ya güvenmek yerine trend çizgisine dayalı bir momentum görünümü.
- Potansiyel giriş ve çıkışları sinyal vermek için net görsel kesişimler.
- Farklı ticaret stillerine uyum sağlamak için özelleştirilebilir düzeltme.
- Alıcı ve satıcı hakimiyetini gerçek zamanlı olarak vurgulayan bir araç.
- Yapısal piyasa analizi ile momentum hesaplamalarını birleştirerek, bu araç hem trend devamı hem de dönüş fırsatlarını tespit etmede benzersiz bir avantaj sağlar.
Özet
Users can customize the indicator’s sensitivity and responsiveness by adjusting the Length (market structure size for trendline detection) and Memory (number of trendlines considered). The tool also offers data and signal smoothing options using various methods, including SMA and triangular moving averages, to provide clearer signals. The Trendlines Oscillator supports alerts for bullish and bearish crossovers and allows customization of line styles and colors. It provides a structural market analysis combined with momentum calculations to help traders assess buyer versus seller dominance and identify trend continuation or reversal opportunities.


